-
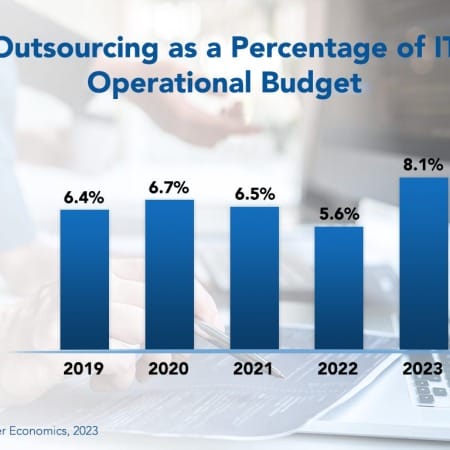
IT Outsourcing Statistics 2023
IT leaders are expecting to increase their outsourcing budgets this year, and they expect to reap outsourcing benefits of streamlined processes and reduced operational costs. The study profiles outsourcing activity for 11 IT functions. For each IT function, we measure the frequency and level of outsourcing. We also look at the current plans of IT organizations to increase or decrease the amount of work they outsource. Finally, we examine the customer experience to assess whether organizations are successfully lowering costs or improving service through outsourcing.
April, 2023
-
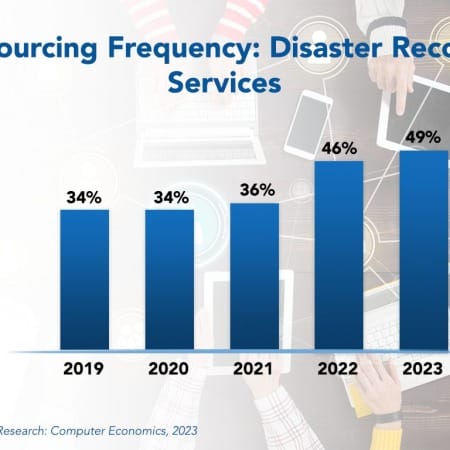
Disaster Recovery Outsourcing Trends and Customer Experience 2023
Experiences over the past three years have revealed that many organizations were not adequately prepared for a worldwide pandemic from a business continuity perspective. But most enterprises responded by establishing remote working environments on short notice and built out the network infrastructure and security measures to support them. Now, emerging from pandemic lockdowns, most businesses are retaining these remote work capabilities, even if they are to support a hybrid work model. Businesses are now more resilient, not just in facing another pandemic but in supporting remote work in the event of other natural or man-made disasters.
June, 2023
-
IT Spending and Staffing Benchmarks 2023/2024: Chapter 17: Nonprofits and Charitable Organizations Sector Benchmarks
Chapter 17 provides benchmarks for nonprofits and charitable organizations. The sector includes local and national charity organizations, conservation groups, youth development organizations, organizing bodies, and other nonprofit organizations. We do not include organizations where the nonprofit status only reflects the entity type, such as nonprofit hospitals, where for all intents and purposes they operate from an IT perspective in a way that is not significantly different from for-profit hospitals. The 24 respondents in the sample range in size from a minimum of about $50 million to $700 million in annual revenue.
July, 2023
-
IT Spending and Staffing Benchmarks 2023/2024: Chapter 28: Brick-and-Mortar Retail Subsector Benchmarks
Chapter 28 provides benchmarks for brick-and-mortar retailers. This subsector includes department stores, clothing stores, convenience stores, pet stores, pharmacies, hardware stores, nonprofit retailers, furniture retailers, agricultural retailers, and other retailers. The 26 respondents in this sample have annual revenue ranging from about $95 million to over $100 billion.
July, 2023
-
Residual Value Forecast November 2023
Our quarterly Residual Value Forecast (RVF) report provides forecasts for the following categories of IT equipment: desktop computers, laptops, network equipment, printers, servers, storage devices, and other IT equipment. It also includes residual values for other non-IT equipment in the following categories: copiers, material handling equipment (forklifts), mail equipment, medical equipment, test equipment, and miscellaneous equipment such as manufacturing machinery and NC machines. Residual Value Forecasts are provided for five years for end-user, wholesale, and orderly liquidation values (OLV) prices.
November, 2023
-
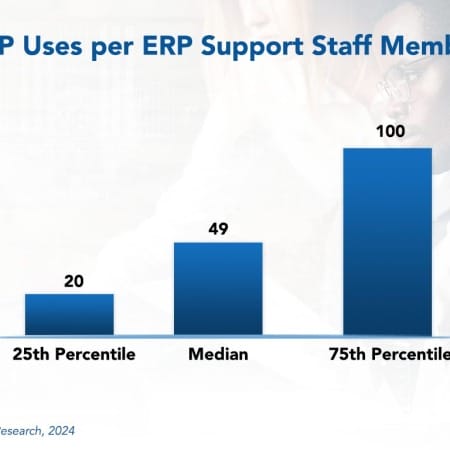
ERP Support Staffing Ratios 2024
Rightsizing the support staff for an ERP system can be difficult. This is because many factors affect the support staffing ratio. These include the type of ERP system, its age, the extent of modification, and the industry sector. Nevertheless, understanding support requirements for ERP systems is vital for IT leaders. This research byte summarizes our full report on ERP support staffing ratios.
January, 2024
-
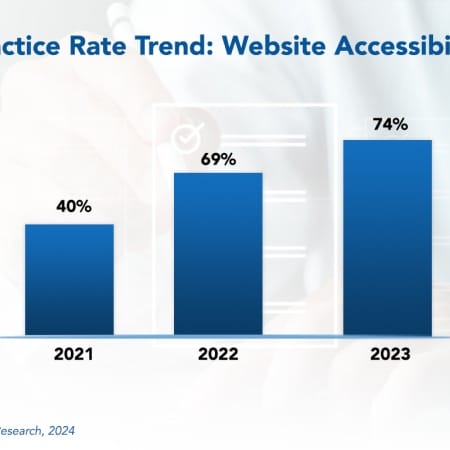
Website Accessibility Best Practices 2024
Website accessibility means building and maintaining websites that anyone can use comfortably and effectively.
February, 2024
-
Banking Process Transformation 2023 RadarView™
The Banking Process Transformation 2023 RadarView™ assists banks and financial companies in identifying strategic partners for banking process transformation by featuring detailed capability and experience analyses of service providers in this space. It provides a 360-degree view of the service providers across practice maturity, domain ecosystem, and investments and innovation, thereby supporting enterprises in identifying the right partner in the banking process transformation space. The 68-page report highlights top supply-side trends in the banking process transformation arena and Avasant’s viewpoint on them.
May, 2023
-

Digital CX Services 2023 Market Insights™
The Digital CX Services 2023 Market Insights™ assists organizations in identifying important demand-side trends that are expected to have a long-term impact on any digital CX services project. The report also highlights key challenges that enterprises face today.
August, 2023
-
Payroll Business Process Transformation 2023–2024 RadarView™
The Payroll Business Process Transformation 2023–2024 RadarView™ assists organizations in identifying strategic partners for payroll business process transformation by offering detailed capability and experience analyses for service providers. It provides a 360-degree view of key payroll business process transformation service providers across practice maturity, domain ecosystem, and investments and innovation, thereby supporting enterprises in identifying the right services partner. The 62-page report highlights top supply-side trends in the payroll space and Avasant’s viewpoint on them.
November, 2023
-

Aerospace and Defense Digital Services 2023–2024 RadarView™
The Aerospace and Defense Digital Services 2023–2024 RadarView™ can help aerospace and defense enterprises craft a robust strategy based on industry outlook, best practices, and digital transformation. The report can also aid them in identifying the right partners and service providers to accelerate their digital transformation in this space. The 69-page report also highlights top market trends in the aerospace and defense industry and Avasant’s viewpoint.
December, 2023
-

Contact Center Business Process Transformation 2023–2024 Market Insights™
The Contact Center Business Process Transformation 2023–2024 Market Insights™ assists organizations in identifying important demand-side trends that are expected to have a long-term impact on any contact center services project. The report also highlights key challenges that enterprises face today.
January, 2024
-

Generative AI: The Next Pivotal Point for Productivity and Efficiency
Generative AI is more than a buzzword. It holds genuine transformational potential that resonates with senior executives and employees across industries. It sparks imagination and innovation by promising to automate tasks previously deemed impossible to replicate by machines. From generating human-like text and creative content to assisting in complex decision-making, generative AI drives a paradigm shift in how businesses operate. This transformative technology is not merely hype but a catalyst for redefining productivity and unleashing unprecedented opportunities for growth and efficiency.
October, 2023

 Grid View
 List View