-
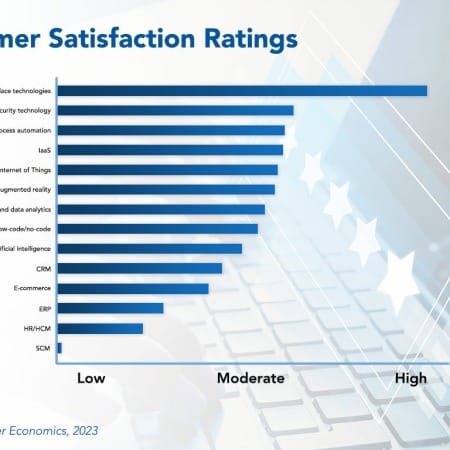
Worldwide Technology Trends 2023
This major study provides insight into the customer experience and adoption rates for 14 technologies that are top-of-mind for IT leaders worldwide. The study also delves into the satisfaction level of the customer experience and the specific types of solutions under consideration. With this information business leaders are in a better position to assess the potential risks and rewards of each of these technologies. They also can gain insight into just how aggressively competitors and peers are making these investments. Looking forward, we also explore 17 future and early adopter technologies.
May, 2023
-
IT Spending and Staffing Benchmarks 2023/2024: Chapter 32: Hospitals Subsector Benchmarks
Chapter 32 provides benchmarks for hospitals. The 34 respondents in this subsector range in size from $50 million to around $8 billion in annual revenue. This category includes community hospitals, university hospitals, nonprofit hospitals, health clinics, healthcare systems, and regional healthcare providers.
July, 2023
-

IT Spending and Staffing Benchmarks 2023/2024: Chapter 23: Food and Beverage Subsector Benchmarks
Chapter 23 provides benchmarks for food and beverage manufacturers. The 31 respondents in the sample range in size from about $65 million to $40 billion in annual revenue. Food and beverage companies produce beverages, snack foods, meat products, seafood products, dairy products, dietary supplements, and other consumable food products. Some are suppliers to other food manufacturers or to the food service industry, while many also distribute consumer products to retailers or direct to consumers. This subsector does not include retailers of food and beverages, such as restaurants, unless they also manufacture their own food and beverage products.
July, 2023
-
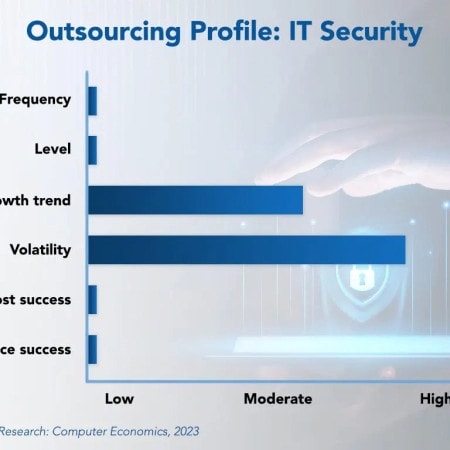
IT Security Outsourcing Trends and Customer Experience 2023
IT security is a major focus for IT leaders that continues to grow in importance. The threat landscape is evolving with increased reliance on the cloud, greater diversity in the IT service portfolio, more employees working from home, and a more burdensome regulatory environment.
November, 2023
-
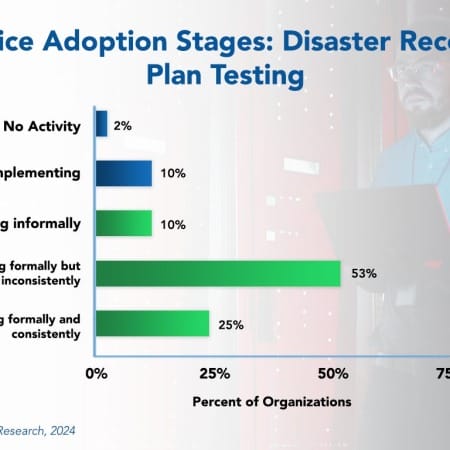
Disaster Recovery Plan Testing Best Practices 2024
In today’s unpredictable business environment, there is an increasing reliance on data and digital systems to operate efficiently. With this comes the need for robust disaster recovery (DR) plans and testing to reduce the impact of unforeseen events. The effectiveness of a DR plan can only be truly validated through routine testing. However, while this practice is growing, few organizations are testing their DR plans formally and consistently. This Research Byte summarizes our full report on disaster recovery plan testing as a best practice.
January, 2024
-
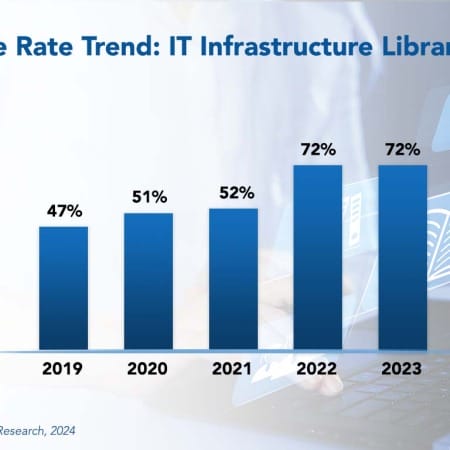
ITIL Best Practices 2024
The Information Technology Infrastructure Library (ITIL) is a framework of best practices and processes designed to assist businesses in supporting, delivering, and improving their IT services. The primary goal of ITIL is to ensure that IT services align with business objectives and customer needs. Frequently adopted ITIL processes include incident management, change management, and problem management.
March, 2024
-

IT Spending and Staffing Benchmarks 2023/2024: Chapter 2: Composite Benchmarks
The IT spending and staffing outlook for 2023 can best be described with the old British slogan, “keep calm and carry on.” As we mentioned in last year’s study, IT budgets are increasingly divorced from economic conditions. As enterprises continue their digital transformation, the IT department is increasingly valuable. Much of that can be attributed to IT’s new seat at the strategic table and the growing perception that technology can drive revenue growth. Despite economic headwinds, we see only a slight pullback in IT spending.
July, 2023
-

IT Spending and Staffing Benchmarks 2023/2024: Chapter 18: Education Sector Benchmarks
Chapter 18 provides benchmarks for the education sector. The sector includes public and private colleges and universities, business and medical schools, for-profit educational institutions, school districts, and foundations. The 28 respondents in the sample have annual revenues ranging in size from a minimum of about $50 million to around $8 billion.
July, 2023
-
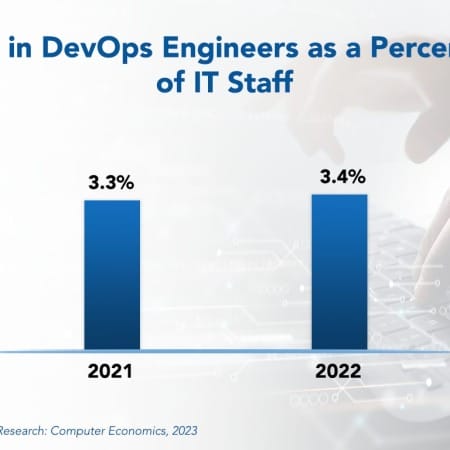
DevOps Engineer Staffing Ratios 2023
DevOps promises to optimize application development and maintenance processes, improving software quality and reducing development time and cost. As a result, IT organizations will be better able to meet the rapidly evolving needs of a business and achieve other strategic goals. Although DevOps engineers today represent a small portion of the total IT staff at most businesses, we anticipate that companies, especially those that develop much of their own software, will continue to expand their DevOps engineering staff.
September, 2023
-
Residual Value Forecast December 2023
Our quarterly Residual Value Forecast (RVF) report provides forecasts for the following categories of IT equipment: desktop computers, laptops, network equipment, printers, servers, storage devices, and other IT equipment. It also includes residual values for other non-IT equipment in the following categories: copiers, material handling equipment (forklifts), mail equipment, medical equipment, test equipment, and miscellaneous equipment such as manufacturing machinery and NC machines. Residual Value Forecasts are provided for five years for end-user, wholesale, and orderly liquidation values (OLV) prices.
December, 2023
-
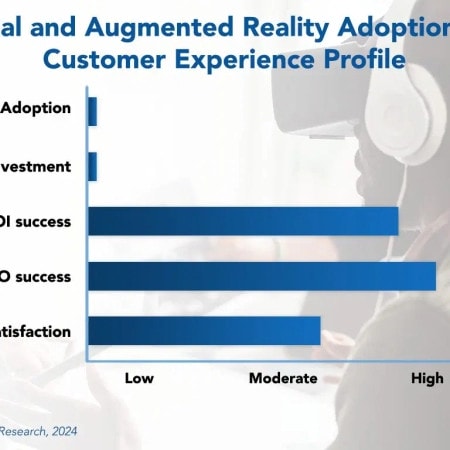
Virtual and Augmented Reality Adoption Trends and Customer Experience 2024
Businesses are currently in the early stages of adopting virtual reality and augmented reality (VR/AR) solutions. While widespread adoption of VR/AR has not yet fully materialized, businesses are actively experimenting with these technologies.
February, 2024
-
Residual Value Forecast March 2024
Our quarterly Residual Value Forecast (RVF) report provides forecasts for the following categories of IT equipment: desktop computers, laptops, network equipment, printers, servers, storage devices, and other IT equipment. It also includes residual values for other non-IT equipment in the following categories: copiers, material handling equipment (forklifts), mail equipment, medical equipment, test equipment, and miscellaneous equipment such as manufacturing machinery and NC machines. Residual Value Forecasts are provided for five years for end-user, wholesale, and orderly liquidation values (OLV) prices.
March, 2024
-

IT Spending and Staffing Benchmarks 2023/2024: Chapter 4: Process Manufacturing Sector Benchmarks
Chapter 4 provides benchmarks for process manufacturers. Process manufacturers are defined as those where the production process adds value by mixing, separating, forming, or chemical reaction. The sector includes manufacturers of chemicals, petrochemicals, semiconductors, pharmaceuticals, dietary supplements, food and beverage products, cosmetics, building materials, packaging materials, steel, glass, paper products, and other process-manufactured goods. The 76 respondents in the sample range in size from a minimum of about $50 million to a maximum of $50 billion in annual revenue.
July, 2023
-
IT Spending and Staffing Benchmarks 2023/2024: Chapter 3A: Small Organization Benchmarks
The IT spending and staffing outlook for small organizations in 2023 can best be described with the old British slogan, “keep calm and carry on.” As we mentioned in last year’s study, IT budgets are increasingly divorced from economic conditions. As enterprises continue their digital transformation, the IT department is increasingly valuable. Much of that can be attributed to IT’s new seat at the strategic table and the growing perception that technology can drive revenue growth. Despite economic headwinds, we see only a slight pullback in IT spending.
July, 2023
-

IT Spending and Staffing Benchmarks 2023/2024: Chapter 19: Commercial Real Estate Sector Benchmarks
Chapter 19 provides benchmarks for commercial real estate organizations. The 36 respondents in the sample range in size from about $50 million to over $4 billion in annual revenue. The sector includes retail, office, industrial, multifamily, and other property management companies, commercial real estate developers, real estate investment firms, and real estate brokers, consultants, and advisors.
July, 2023

 Grid View
 List View