-
Data Center Managed Services 2023–2024 RadarView™
The Data Center Managed Services 2023–2024 RadarView™ assists organizations in identifying strategic partners for data center managed services by offering detailed capability and experience analyses for service providers. It provides a 360-degree view of key data center managed service providers across practice maturity, partner ecosystem, and investments and innovation, thereby supporting enterprises in identifying the right services partner. The 68-page report highlights top supply-side trends in the data center managed services space and Avasant’s viewpoint on them.
November, 2023
-
Product Lifecycle Management Software 2023 RadarView Scan™
Avasant’s Product Lifecycle Management Software 2023 RadarView™ Scan helps enterprises in evaluating key vendors providing PLM software. The 31-page report also highlights how vendors leverage their capabilities to provide PLM services to address these challenges.
December, 2023
-

European IT Spending and Staffing Benchmarks 2023/2024: Chapter 10: Energy and Utilities Sector Benchmarks
Chapter 10 provides benchmarks for public utilities, oil and gas producers, service companies, and midstream distributors across all organization sizes. The 18 respondents in this sector include public utilities (water, gas, and electric), regional utilities, integrated energy companies, natural gas companies, pipeline operators, and other energy and utilities companies. The companies in our sample range in size from a minimum of about €150 million to more than €100 billion in annual revenue.
September, 2023
-
Generative AI Strategy, Spending, and Adoption Metrics 2024: Chapter 3: Manufacturing Sector Benchmarks
This chapter concentrates on the manufacturing sector. It features a sample of 32 manufacturers including both process and discrete manufacturing.This chapter provides generative AI metrics for the manufacturing sector. It features a sample of 32 manufacturers including both process and discrete manufacturing. Among the sample are those that manufacture food and beverages, life sciences and pharmaceuticals, cars and car parts, industrial equipment, chemicals, and consumer goods. It includes metrics on how much enterprises are spending on generative AI, where they are spending it, and how they are governing it.
December, 2023
-
IT Spending and Staffing Benchmarks 2023/2024: Chapter 11: Healthcare Services Sector Benchmarks
Chapter 11 provides benchmarks for healthcare services companies. The 48 respondents in this sector include community hospital groups, multiregional hospital systems, healthcare systems, dental service organizations, university hospitals, long-term care facilities, and other healthcare organizations. These organizations range in size from a minimum of about $50 million to $10 billion in annual revenue.
July, 2023
-
IT Spending and Staffing Benchmarks 2023/2024: Chapter 37: Logistics Subsector Benchmarks
Chapter 37 provides benchmarks for logistics providers. The 19 respondents in this sample range in size from $52 million to about $50 billion. The sector is comprised of logistics companies that transport goods, including refined petroleum distributors, national moving or courier companies, freight transportation companies, supply chain logistics providers, and other logistics companies.
July, 2023
-
IT Spending and Staffing Benchmarks 2023/2024: Chapter 1: Executive Summary
The Computer Economics IT Spending and Staffing Benchmarks study (the "ISS"), published annually since 1990, is the definitive source for IT spending and staffing benchmarks and IT performance statistics across multiple industries and government sectors. Download a free copy of the 60+ pages Executive Summary (Chapter 1), which includes a detailed analysis of our major findings of this year's report. It also includes important, high-level IT spending and staffing ratios and trends, including metrics on IT spending as a percentage of revenue, IT spending per user, IT spending growth, IT capital budgets, IT spending priorities, and IT staff count changes.
July, 2023
-
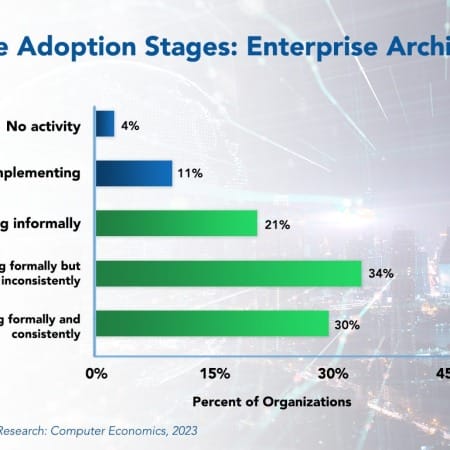
Enterprise Architecture Adoption and Best Practices 2023
While large IT project failures generate headlines, an even larger risk may be the incoherence that comes from developing new systems and capabilities without an overall plan. Enterprise architecture is an IT best practice that provides a description of the organization in its desired state. This allows developers to build an infrastructure, data model, systems, and process that are aligned with that organizational architecture.
October, 2023
-

Best Practices for Benchmarking Your IT Budget Ratios
Benchmarking is a popular way for IT executives to justify their IT budgets and better focus their efforts to achieve a state of continuous improvement. Whether it is to compare their IT spending levels with industry peers, defend current spending levels, justify new spending requests, or identify opportunities for cost improvement, benchmarking is the best way to objectively measure an organization’s IT budget against industry standards.
December, 2023
-
IT Security Staffing Ratios 2024
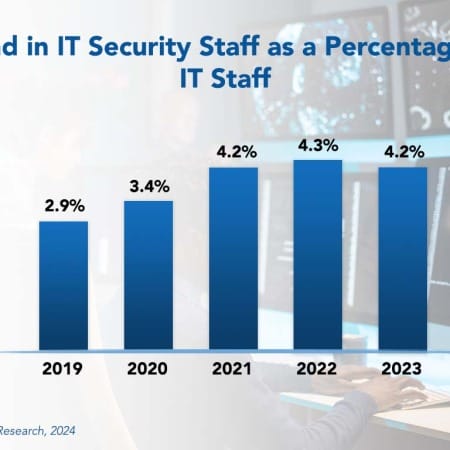
The constant beating drum of new security vectors and the recent impact of remote and hybrid work have placed pressure on IT security staffing levels. Enterprises have been steadily increasing IT security budgets and personnel for years. However, IT security personnel as a percentage of the total IT staff has decreased slightly from 4.3% in 2022 to 4.2% in 2023. For three years, security personnel as a percentage has been flat, ranging between 4.2% and 4.3%. Has the supply of IT security personnel finally reached its cap?
February, 2024
-
IT Staffing Ratios: Benchmarking Metrics and Analysis for 17 Key IT Job Functions
The analysis of IT staffing data has been a core competency of Computer Economics since we began publishing our annual IT Spending and Staffing Benchmarks study in 1990. Each year, we survey more than 200 IT organizations across 10 major industry sectors, based on our sampling model, to obtain data on IT staffing levels, server counts, network infrastructure, outsourcing, and spending, among other information pertinent to the assessment of IT staffing.
March, 2024
-

Applied AI Services 2022–2023 Market Insights™
The Applied AI Services 2022–2023 Market Insights™ assists organizations in identifying important demand-side trends that are expected to have a long-term impact in the future for any applied AI projects. The report also highlights key challenges that enterprises face today.
May, 2023

 Grid View
 List View