-

Contact Center Business Process Transformation 2023–2024 RadarView™
The Contact Center Business Process Transformation 2023–2024 RadarView™ provides information to assist enterprises in building a contact center service strategy and charting an action plan for customer service transformation. It identifies key global contact center service providers that can help expedite this transformation. It also brings out detailed capability and experience analyses of leading providers to assist businesses in identifying the right strategic partners. The 81-page report highlights key industry trends in the contact center space and Avasant’s viewpoint on them.
January, 2024
-

Open Innovation – The Catalyst for Transforming India’s Technology Ecosystem
This report, developed in collaboration with nasscom, assesses the status of Open Innovation (OI) in India and its global context. It explores investments and initiatives by the Indian government, industry bodies, and the private sector to promote OI. The report identifies India’s potential to rank in the top 10 for global innovation, emphasizing OI’s role in addressing local needs, fostering inclusivity, and supporting innovative ventures. It provides recommendations for advancing OI and highlights opportunities for collaboration across sectors, including corporates, academia, and government agencies.
November, 2023
-
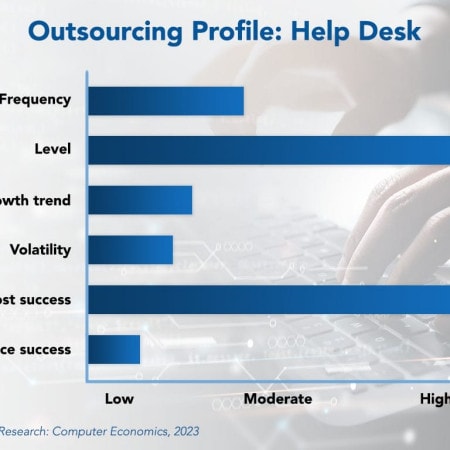
IT Help Desk Outsourcing Trends and Customer Experience 2023
The decision to turn over an IT organization’s help desk function to a service provider has a long and varied history. It is one of the services that helped establish the contemporary IT outsourcing industry. Our research shows that 50% of IT organizations surveyed currently rely on service providers to perform the help desk function, at any level of utilization.
November, 2023
-
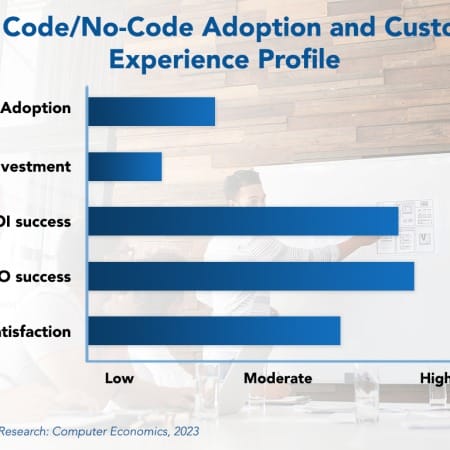
Low-Code/No-Code Adoption Trends and Customer Experience 2024
Low-Code/No-Code (LC/NC) platforms are becoming increasingly popular in enterprise software development. LC/NC enables non-technical users and citizen developers to quickly create software applications with little to no manual coding. Using a visual drag-and-drop interface, pre-built components, and templates, LC/NC platforms allow users to create applications without requiring a high level of coding knowledge. This capability is invaluable for companies of all sizes because it lowers development costs, speeds up development, and improves agility.
January, 2024
-
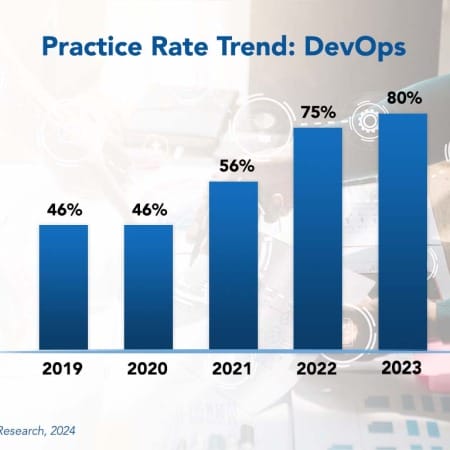
DevOps Best Practices 2024
Development operations (DevOps) is an organizational model that promotes collaboration between software developers and IT operations. The model allows for frequent deployment of systemic changes and includes a use for automation. DevOps is a natural extension of agile development into the deployment and operational phases of the systems life cycle. Just as agile development builds software in small, iterative build cycles, DevOps applies enhancements as small incremental changes committed daily, hourly, or even moment-by-moment into the production system.
February, 2024
-
IT Spending and Staffing Benchmarks 2023/2024: Chapter 11: Healthcare Services Sector Benchmarks
Chapter 11 provides benchmarks for healthcare services companies. The 48 respondents in this sector include community hospital groups, multiregional hospital systems, healthcare systems, dental service organizations, university hospitals, long-term care facilities, and other healthcare organizations. These organizations range in size from a minimum of about $50 million to $10 billion in annual revenue.
July, 2023
-
IT Spending and Staffing Benchmarks 2023/2024: Chapter 37: Logistics Subsector Benchmarks
Chapter 37 provides benchmarks for logistics providers. The 19 respondents in this sample range in size from $52 million to about $50 billion. The sector is comprised of logistics companies that transport goods, including refined petroleum distributors, national moving or courier companies, freight transportation companies, supply chain logistics providers, and other logistics companies.
July, 2023
-
IT Spending and Staffing Benchmarks 2023/2024: Chapter 1: Executive Summary
The Computer Economics IT Spending and Staffing Benchmarks study (the "ISS"), published annually since 1990, is the definitive source for IT spending and staffing benchmarks and IT performance statistics across multiple industries and government sectors. Download a free copy of the 60+ pages Executive Summary (Chapter 1), which includes a detailed analysis of our major findings of this year's report. It also includes important, high-level IT spending and staffing ratios and trends, including metrics on IT spending as a percentage of revenue, IT spending per user, IT spending growth, IT capital budgets, IT spending priorities, and IT staff count changes.
July, 2023
-
European IT Spending and Staffing Benchmarks 2023/2024: Chapter 13: Transportation and Logistics Sector Benchmarks
Chapter 13 provides benchmarks for the transportation and logistics sector. The 15 respondents in this sample range in size from a minimum of about €120 million to over €5 billion. The category includes organizations that operate buses, trucks, railways, airlines, barges, and ships. The sector also includes logistics companies that transport goods and transportation companies as well as regional and national transportation authorities that move people.
September, 2023
-
Generative AI Strategy, Spending, and Adoption Metrics 2024: Chapter 5: BFSI Sector Benchmarks
This chapter provides generative AI metrics for the banking, financial services, and insurance (BFSI) sector. It features a sample of 34 such firms, ranging from commercials and investment banks to brokerages, financial advisors, and wealth management firms. They also include regional and national insurance including health insurance and property and casualty. It includes metrics on how much enterprises are spending on generative AI, where they are spending it, and how they are governing it.
December, 2023
-
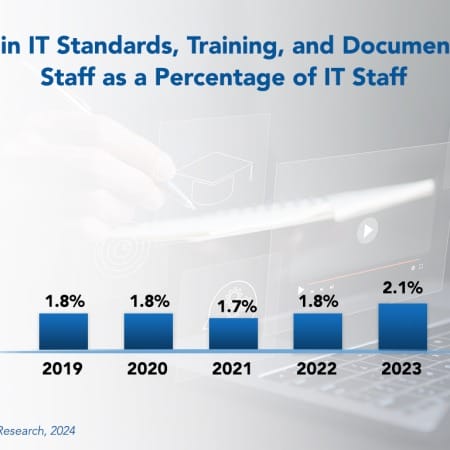
IT Standards, Training, and Documentation Staffing Ratios 2024
Some organizations tend to underestimate the importance of the IT standards, training, and documentation job function since its impact on the bottom line may not be clear. However, these job functions are essential for ensuring the smooth operation, compliance, and effectiveness of IT systems — all crucial elements for the overall success of any business.
April, 2024
-
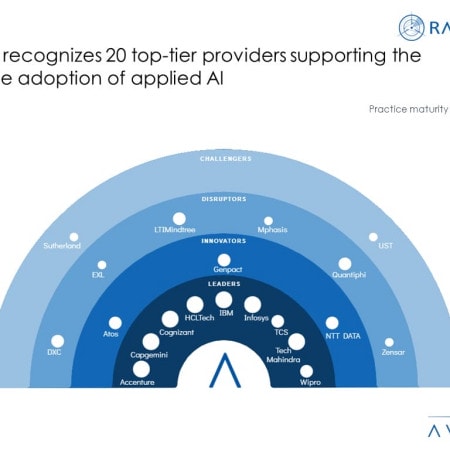
Applied AI Services: Building the AI Ecosystem for the Future
With advancements in the current AI landscape, enterprises are increasing their investments in new technologies such as generative AI, computer vision, and edge AI. Businesses across industries have realized the tremendous optimization opportunities AI brings and how it aids them in improving operational efficiency while ensuring sustainability. In addition, increasing regulation and compliance around AI systems and data use is helping companies use AI systems more ethically. Both demand- and supply-side trends are covered in Avasant’s Applied AI Services 2022–2023 Market Insights™ and Applied AI Services 2022–2023 RadarView™, respectively.
May, 2023
-
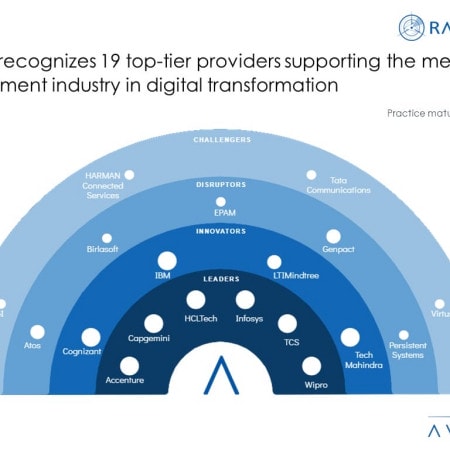
Media and Entertainment Digital Services: Leveraging Digital Technology to Drive Innovation and Bolster Customer Experience
To adapt to evolving customer demands, media and entertainment (M&E) firms are investing in digital technologies to provide personalized and immersive content to users and enhance the customer experience. In addition, regulatory requirements and customer preference for climate-conscious firms are compelling M&E enterprises to embrace ESG as a fundamental way of doing business. As a result, M&E companies are utilizing emerging technologies to offer low-latency immersive content and enhance customer experience while mitigating churn. Both demand- and supply-side trends are covered in Avasant’s Media and Entertainment Digital Services 2023–2024 Market Insights™ and Media and Entertainment Digital Services 2023–2024 RadarView™, respectively.
June, 2023
-

Embedding Digital-First Principles in Businesses
In the fast-paced and ever-evolving world of technology, businesses constantly seek innovative ways to stay ahead of their competition. One approach that has proven to be a game-changer is the digital-first principle. This approach emphasizes putting digital technologies and strategies at the forefront of an organization’s operations, paving the way for improved efficiency, customer experience, and overall profitability of the business. In this research byte, we explore the significance of embedding digital-first principles into the core of businesses, the profound impact it can have on their growth and sustainability, and how service providers are helping to facilitate this transformation. We highlight the efforts of one such service provider, Unisys, based on its recent analyst and advisor event held in June 2023.
August, 2023

 Grid View
 List View