-
IT Spending and Staffing Benchmarks 2023/2024: Chapter 20: Media and Information Services Sector Benchmarks
Chapter 20 provides benchmarks for the media and information services sector. The sector includes publishing, broadcasting, entertainment, and digital media organizations, as well as other media and information services companies. The 14 respondents in the sample have annual revenues ranging in size from about $50 million to around $50 billion.
July, 2023
-

IT Spending and Staffing Benchmarks 2023/2024: Chapter 29: Online Retail Subsector Benchmarks
Chapter 29 provides benchmarks for online retailers. This subsector includes clothing retailers, home furnishing retailers, dietary supplements and health products retailers, agricultural retailers, pharmaceutical retailers, educational products retailers, sports equipment retailers, and other online retailers. The 20 respondents in this sample have annual revenue ranging from about $100 million to over $100 billion.
July, 2023
-

European IT Spending and Staffing Benchmarks 2023/2024: Chapter 4: Process Manufacturing Sector Benchmarks
Chapter 4 provides benchmarks for process manufacturers. Process manufacturers are defined as those where the production process adds value by mixing, separating, forming, or chemical reaction. The sector includes manufacturers of chemicals, petrochemicals, semiconductors, pharmaceuticals, dietary supplements, food and beverage products, cosmetics, building materials, packaging materials, steel, glass, paper products, and other process-manufactured goods. The 47 respondents in the sample range in size from a minimum of about €65 million to a maximum of about €40 billion in annual revenue.
September, 2023
-

European IT Spending and Staffing Benchmarks 2023/2024: Chapter 20: Industrial and Automotive Subsector Benchmarks
Chapter 20 provides benchmarks for industrial and automotive manufacturers. The 20 respondents in this subsector make auto parts, material handling equipment, engines, machinery, vehicles, and similar capital goods. The manufacturers in the sample range in size from €120 million to over €250 billion in annual revenue.
September, 2023
-
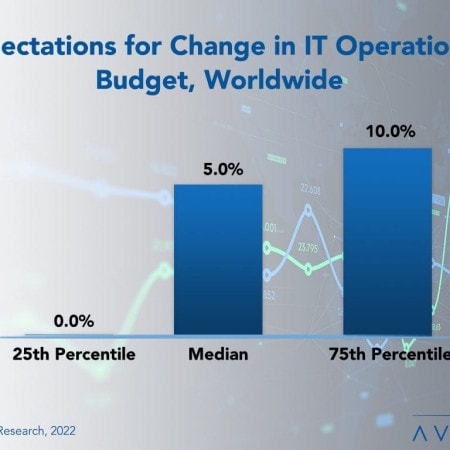
Worldwide IT Spending And Staffing Outlook 2023
Despite most of our survey respondents agreeing that the economy will be worse in 2023 than in 2022, IT spending increases are broad and strong. However, in this annual report of the IT spending and staffing outlook for 2023, we believe there is another major factor at play. We find that IT is no longer seen as a cost center but as a strategic driver of growth. Because of this, business leaders are giving their IT departments greater resources to help plan for the coming recession rather than asking them to tighten their belts.
February, 2023
-
IT Spending and Staffing Benchmarks 2023/2024: Chapter 32: Hospitals Subsector Benchmarks
Chapter 32 provides benchmarks for hospitals. The 34 respondents in this subsector range in size from $50 million to around $8 billion in annual revenue. This category includes community hospitals, university hospitals, nonprofit hospitals, health clinics, healthcare systems, and regional healthcare providers.
July, 2023
-
IT Spending and Staffing Benchmarks 2023/2024: Chapter 23: Food and Beverage Subsector Benchmarks
Chapter 23 provides benchmarks for food and beverage manufacturers. The 31 respondents in the sample range in size from about $65 million to $40 billion in annual revenue. Food and beverage companies produce beverages, snack foods, meat products, seafood products, dairy products, dietary supplements, and other consumable food products. Some are suppliers to other food manufacturers or to the food service industry, while many also distribute consumer products to retailers or direct to consumers. This subsector does not include retailers of food and beverages, such as restaurants, unless they also manufacture their own food and beverage products.
July, 2023
-

European IT Spending and Staffing Benchmarks 2023/2024: Chapter 5: Discrete Manufacturing Sector Benchmarks
Chapter 5 provides benchmarks for discrete manufacturing organizations. Discrete manufacturers are defined as those where the production process adds value by fabricating or assembling individual (discrete) unit production. The category includes manufacturers of consumer products, athletic equipment, industrial equipment, telecommunications equipment, aerospace products, furniture, auto parts, electrical parts, medical devices, and electronic devices, among other products. The 44 respondents in this sample range in size from a minimum of about €75 million to over €200 billion in annual revenue.
September, 2023
-

European IT Spending and Staffing Benchmarks 2023/2024: Chapter 21: Brick and Mortar Retail Subsector Benchmarks
Chapter 21 provides benchmarks for brick-and-mortar retailers. This subsector includes department stores, clothing stores, convenience stores, pet stores, pharmacies, hardware stores, nonprofit retailers, furniture retailers, agricultural retailers, and other retailers. The 34 respondents in this sample have annual revenue ranging from about €95 million to over €25 billion.
September, 2023
-

IT Spending and Staffing Benchmarks 2023/2024: Chapter 2: Composite Benchmarks
The IT spending and staffing outlook for 2023 can best be described with the old British slogan, “keep calm and carry on.” As we mentioned in last year’s study, IT budgets are increasingly divorced from economic conditions. As enterprises continue their digital transformation, the IT department is increasingly valuable. Much of that can be attributed to IT’s new seat at the strategic table and the growing perception that technology can drive revenue growth. Despite economic headwinds, we see only a slight pullback in IT spending.
July, 2023
-

IT Spending and Staffing Benchmarks 2023/2024: Chapter 18: Education Sector Benchmarks
Chapter 18 provides benchmarks for the education sector. The sector includes public and private colleges and universities, business and medical schools, for-profit educational institutions, school districts, and foundations. The 28 respondents in the sample have annual revenues ranging in size from a minimum of about $50 million to around $8 billion.
July, 2023
-

European IT Spending and Staffing Benchmarks 2023/2024: Chapter 6: Banking and Finance Sector Benchmarks
Chapter 6 provides benchmarks for banking and financial services companies. The firms in this sector include commercial banks, investment banks, mortgage lenders, consumer finance lenders, and other types of lenders and financial services providers. The 17 respondents in this sector range in size from a minimum of about €100 million to over €30 billion in annual sales.
September, 2023
-

European IT Spending and Staffing Benchmarks 2023/2024: Chapter 22: Online Retail Subsector Benchmarks
Chapter 22 provides benchmarks for online retailers. This subsector includes clothing retailers, home furnishing retailers, dietary supplements and health products retailers, agricultural retailers, pharmaceutical retailers, educational products retailers, sports equipment retailers, and other online retailers. The 15 respondents in this sample have annual revenue ranging from about €100 million to about €20 billion.
September, 2023
-

IT Spending and Staffing Benchmarks 2023/2024: Chapter 4: Process Manufacturing Sector Benchmarks
Chapter 4 provides benchmarks for process manufacturers. Process manufacturers are defined as those where the production process adds value by mixing, separating, forming, or chemical reaction. The sector includes manufacturers of chemicals, petrochemicals, semiconductors, pharmaceuticals, dietary supplements, food and beverage products, cosmetics, building materials, packaging materials, steel, glass, paper products, and other process-manufactured goods. The 76 respondents in the sample range in size from a minimum of about $50 million to a maximum of $50 billion in annual revenue.
July, 2023
-
IT Spending and Staffing Benchmarks 2023/2024: Chapter 3A: Small Organization Benchmarks
The IT spending and staffing outlook for small organizations in 2023 can best be described with the old British slogan, “keep calm and carry on.” As we mentioned in last year’s study, IT budgets are increasingly divorced from economic conditions. As enterprises continue their digital transformation, the IT department is increasingly valuable. Much of that can be attributed to IT’s new seat at the strategic table and the growing perception that technology can drive revenue growth. Despite economic headwinds, we see only a slight pullback in IT spending.
July, 2023

 Grid View
 List View