-

IT Spending and Staffing Benchmarks 2023/2024: Chapter 16: Government Sector Benchmarks
Chapter 16 provides benchmarks for government organizations. The 36 respondents in the sample range in size from about $44 million to $40 billion in annual revenue. The category includes city and county governments, federal and state agencies, law enforcement agencies, organizations that provide IT services to government agencies, and other government organizations.
July, 2023
-

IT Spending and Staffing Benchmarks 2023/2024: Chapter 25: Aerospace and Defense Subsector Benchmarks
Chapter 25 provides benchmarks for aerospace and defense companies. The category includes airplane and aerospace manufacturers, makers of weapons systems, aerospace and defense research, and other defense companies. The 17 respondents in this sample range in size from a minimum of about $50 million to around $20 billion in revenue.
July, 2023
-

European IT Spending and Staffing Benchmarks 2023/2024: Chapter 3B: Midsize Organization Benchmarks
In these chapters, we provide a complete set of benchmarks for organizations within the specified size classification. IT operational budgets between €5 million and less than €25 million.
September, 2023
-

European IT Spending and Staffing Benchmarks 2023/2024: Chapter 18: Food and Beverage Subsector Benchmarks
Chapter 18 provides benchmarks for food and beverage manufacturers. The 23 respondents in the sample range in size from €100 million to over €25 billion in annual revenue. Food and beverage companies produce beverages, meat products, seafood products, dairy products, dietary supplements, bakery ingredients, and other consumable food products. Some are suppliers to other food manufacturers or to the food service industry, while many also distribute consumer products to retailers or direct to consumers.
September, 2023
-
IT Spending and Staffing Benchmarks 2023/2024: Chapter 17: Nonprofits and Charitable Organizations Sector Benchmarks
Chapter 17 provides benchmarks for nonprofits and charitable organizations. The sector includes local and national charity organizations, conservation groups, youth development organizations, organizing bodies, and other nonprofit organizations. We do not include organizations where the nonprofit status only reflects the entity type, such as nonprofit hospitals, where for all intents and purposes they operate from an IT perspective in a way that is not significantly different from for-profit hospitals. The 24 respondents in the sample range in size from a minimum of about $50 million to $700 million in annual revenue.
July, 2023
-

IT Spending and Staffing Benchmarks 2023/2024: Chapter 28: Brick-and-Mortar Retail Subsector Benchmarks
Chapter 28 provides benchmarks for brick-and-mortar retailers. This subsector includes department stores, clothing stores, convenience stores, pet stores, pharmacies, hardware stores, nonprofit retailers, furniture retailers, agricultural retailers, and other retailers. The 26 respondents in this sample have annual revenue ranging from about $95 million to over $100 billion.
July, 2023
-

European IT Spending and Staffing Benchmarks 2023/2024: Chapter 3C: Large Organization Benchmarks
In these chapters, we provide a complete set of benchmarks for organizations within the specified size classification. IT operational budgets €25 million or greater.
September, 2023
-

European IT Spending and Staffing Benchmarks 2023/2024: Chapter 19: Chemicals Subsector Benchmarks
Chapter 19 provides benchmarks for chemicals manufacturers. Chemicals manufacturers are by definition process manufacturers that produce chemical products. The sector includes manufacturers of chemicals, petrochemicals, and other chemical products. The 14 respondents in the sample range in size from a minimum of about €50 million to around €40 billion in annual revenue.
September, 2023
-
IT Spending and Staffing Benchmarks 2023/2024: Chapter 20: Media and Information Services Sector Benchmarks
Chapter 20 provides benchmarks for the media and information services sector. The sector includes publishing, broadcasting, entertainment, and digital media organizations, as well as other media and information services companies. The 14 respondents in the sample have annual revenues ranging in size from about $50 million to around $50 billion.
July, 2023
-

IT Spending and Staffing Benchmarks 2023/2024: Chapter 29: Online Retail Subsector Benchmarks
Chapter 29 provides benchmarks for online retailers. This subsector includes clothing retailers, home furnishing retailers, dietary supplements and health products retailers, agricultural retailers, pharmaceutical retailers, educational products retailers, sports equipment retailers, and other online retailers. The 20 respondents in this sample have annual revenue ranging from about $100 million to over $100 billion.
July, 2023
-

European IT Spending and Staffing Benchmarks 2023/2024: Chapter 4: Process Manufacturing Sector Benchmarks
Chapter 4 provides benchmarks for process manufacturers. Process manufacturers are defined as those where the production process adds value by mixing, separating, forming, or chemical reaction. The sector includes manufacturers of chemicals, petrochemicals, semiconductors, pharmaceuticals, dietary supplements, food and beverage products, cosmetics, building materials, packaging materials, steel, glass, paper products, and other process-manufactured goods. The 47 respondents in the sample range in size from a minimum of about €65 million to a maximum of about €40 billion in annual revenue.
September, 2023
-

European IT Spending and Staffing Benchmarks 2023/2024: Chapter 20: Industrial and Automotive Subsector Benchmarks
Chapter 20 provides benchmarks for industrial and automotive manufacturers. The 20 respondents in this subsector make auto parts, material handling equipment, engines, machinery, vehicles, and similar capital goods. The manufacturers in the sample range in size from €120 million to over €250 billion in annual revenue.
September, 2023
-
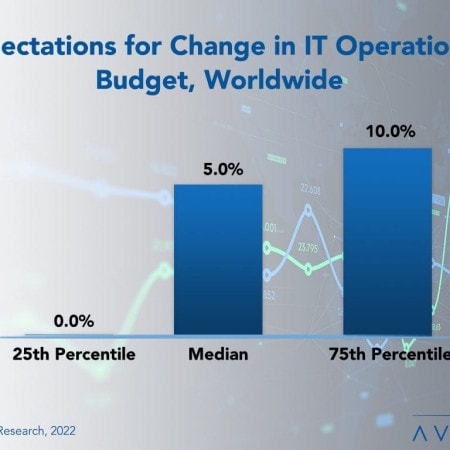
Worldwide IT Spending And Staffing Outlook 2023
Despite most of our survey respondents agreeing that the economy will be worse in 2023 than in 2022, IT spending increases are broad and strong. However, in this annual report of the IT spending and staffing outlook for 2023, we believe there is another major factor at play. We find that IT is no longer seen as a cost center but as a strategic driver of growth. Because of this, business leaders are giving their IT departments greater resources to help plan for the coming recession rather than asking them to tighten their belts.
February, 2023
-
IT Spending and Staffing Benchmarks 2023/2024: Chapter 32: Hospitals Subsector Benchmarks
Chapter 32 provides benchmarks for hospitals. The 34 respondents in this subsector range in size from $50 million to around $8 billion in annual revenue. This category includes community hospitals, university hospitals, nonprofit hospitals, health clinics, healthcare systems, and regional healthcare providers.
July, 2023
-
IT Spending and Staffing Benchmarks 2023/2024: Chapter 23: Food and Beverage Subsector Benchmarks
Chapter 23 provides benchmarks for food and beverage manufacturers. The 31 respondents in the sample range in size from about $65 million to $40 billion in annual revenue. Food and beverage companies produce beverages, snack foods, meat products, seafood products, dairy products, dietary supplements, and other consumable food products. Some are suppliers to other food manufacturers or to the food service industry, while many also distribute consumer products to retailers or direct to consumers. This subsector does not include retailers of food and beverages, such as restaurants, unless they also manufacture their own food and beverage products.
July, 2023

 Grid View
 List View