
In assessing risks to their organizations’ information and systems, information technology security professionals face an evolving array of threats. Last year’s defenses may not be adequate to counter the threats of this year’s attacks. Therefore, it is important for executives to have an awareness of the seriousness of each type of IT security risk and how threat levels are changing.
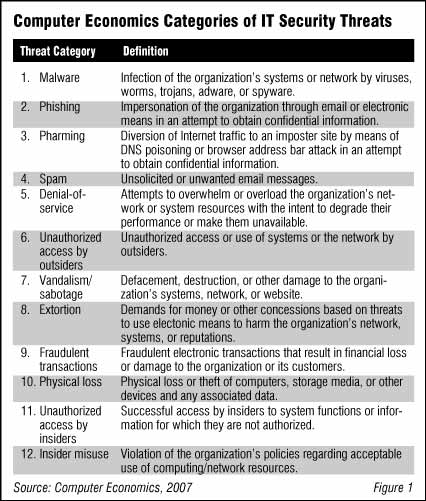
This article is an executive summary of our full report, Trends in IT Security Threats: 2007, which analyzes the 12 categories of computer security threats as shown in Figure 1.
For each category, the full report analyzes the perceived seriousness of each category of computer crime and how threat levels have changed in the last 12 months. In addition, we provide high level statistics on the number of incidents reported for each category.
This information technology risk assessment is based on a survey of over 100 IT security and risk management professionals, conducted by Computer Economics in the fourth quarter of 2006.
Summary of Major Findings
Analysis of these survey results provides insights into how IT professionals perceive the seriousness of 12 categories of information security threats and how these threat levels are changing. Some of these results are encouraging, but some may indicate a gap between perception and reality.
The full report describes these trends and information security statistics in more detail, including the relationships between various types of computer security threats. For each category, we analyze current perceptions of the threat level and how the threat level has changed in the past 12 months. We also analyze the connection between reported number of IT security events and the perceptions of threat levels. Differences in responses based on industry are noted where significant.
Demographics
Although responses to this survey were received from organizations on every continent, the majority of participants (67%) are based in the U.S. and Canada. Asia and Australia account for 12% of the responses, followed by Europe at 10%. Africa and Central/South America together account for 11% of the responses.
In terms of industry sectors, banking and finance organizations have the largest representation in our sample at 14%. Government and high tech organizations are also well represented, at 11% and 10% respectively. The rest of the participants are from a wide variety of industry types. Job responsibilities of respondents include information security (infosec) management positions such as Chief Security Officer (CSO) and Chief Information Security Officer (CISO); infosec technical professionals; IT management positions, such as CIO; risk management positions, and other executive positions with direct knowledge of their organizations’ IT security experiences.
In selecting the sample for this survey, we paid special attention to the size of the organization, so that the respondents would be dominated by companies with over 100 employees. The largest group comprises organizations with 100 to 1,000 employees (38%). Nearly 30% of the respondents come from organizations with 1,000 to 5,000 employees. Another 20% of the respondents come from companies with over 5,000 employees. Organizations with less than 100 employees only comprise 13% of the sample.
Table of Contents
List of Figures
Figure 1: Computer Economics Categories of IT Security Threats
Figure 2: IT Security Threats Ranked by Seriousness
Figure 3: Change in Threat Levels Over Past 12 Months
Figure 4: Seriousness of Malware Attacks
Figure 5: Malware: Change in Threat Level in Past Year
Figure 6: Seriousness of Phishing Attacks
Figure 7: Phishing: Change in Threat Level in Past Year
Figure 8: Seriousness of Pharming Attacks
Figure 9: Pharming: Change in Threat Level in Past Year
Figure 10: Seriousness of Spam Attacks
Figure 11: Spam: Change in Threat Level in Past Year
Figure 12: Seriousness of Denial of Service Attacks
Figure 13: Denial of Service: Change in Threat Level in Past Year
Figure 14: Seriousness of Unauthorized Access by Outsiders
Figure 15: Unauthorized Access by Outsiders: Change in Threat Level in Past Year
Figure 16: Seriousness of Vandalism/Sabotage
Figure 17: Vandalism/Sabotage: Change in Threat Level in Past Year
Figure 18: Seriousness of Extortion Attempts
Figure 19: Extortion Attempts: Change in Threat Level in Past Year
Figure 20: Seriousness of Fraudulent Transactions
Figure 21: Fraudulent Transactions: Change in Threat Level in Past Year
Figure 22: Seriousness of Physical Loss of Computing Devices and Storage
Figure 23: Physical Loss: Change in Threat Level in Past Year
Figure 24: Seriousness of Unauthorized Access by Insiders
Figure 25: Unauthorized Access by Insiders: Change in Threat Level in Past Year
Figure 26: Seriousness of Insider Misuse
Figure 27: Insider Misuse: Change in Threat Level in Past Year
Figure 28: Respondents by Location
Figure 29: Respondents by Industry
Figure 30: Respondents by Number of Employees
April 2007
This Research Byte is a brief overview of our report on this subject, Trends in IT Security Threats: 2007, which provides useful input to an organization’s overall information security risk management program. The full report is available at no charge for Computer Economics clients, or it may be purchased by non-clients directly from our website at https://avasant.com/report/trends-in-it-security-threats-2007/ (click for pricing).