
The process of developing and maintaining enterprise applications is changing. Agile methodologies and DevOps are contributing factors to the decline in application developer staffing ratios. Low-code/no-code, rapid application development approaches that aim to reduce coding and application development times further reduce the need for developers. Developers still make up the largest portion of most IT organizations, and they are quite expensive. Therefore, IT leaders should assess their developer needs in order to optimize their personnel budgets.
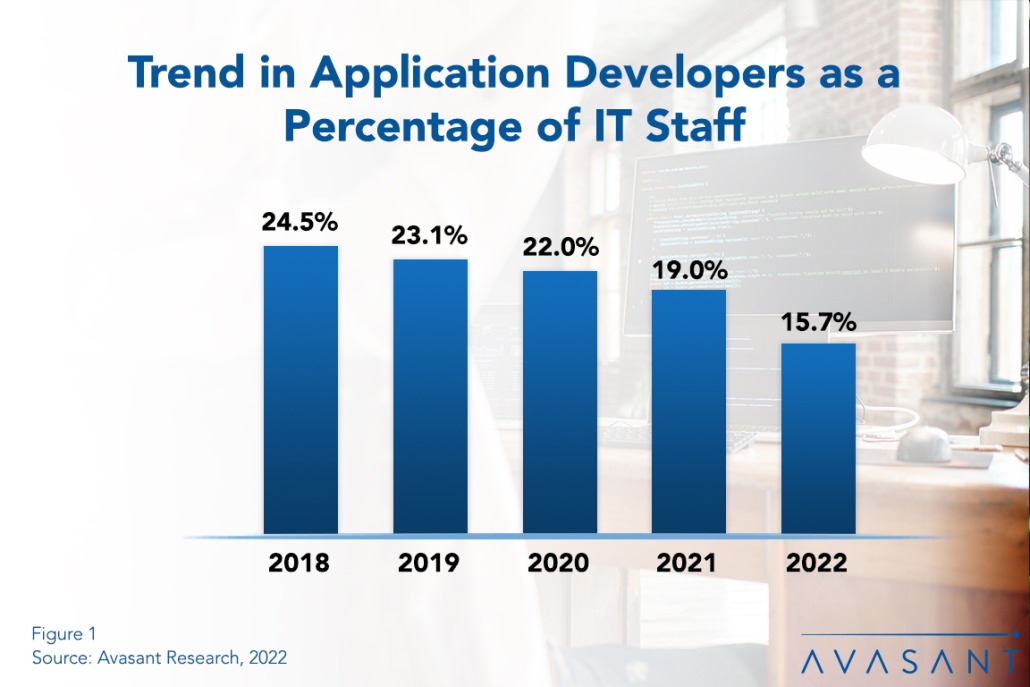
As shown in Figure 1 from our full report, Application Developer Staffing Ratios, the ratio is 15.7% of the total IT staff at the median in 2022, down from 19.0% in 2021 and 22.0% in 2020. In 2018, the ratio stood at 24.5%, nearly nine percentage points higher than it is today. The decline is steady and pronounced.
Application developers are not the only ones building and maintaining software these days. In the growing low-code/no-code movement, IT personnel outside the development group, as well as power users in business units, are being empowered to create and maintain their own apps. These tools allow users to assemble new applications through drag-and-drop form builders, visual process modeling, and code reuse. And application-creation tools have become simplified and cost-effective to allow nonprogrammers (so-called citizen developers) to create useful apps from scratch without ever writing a line of code.
The low-code/no-code trend is relatively new, and there is sometimes resistance from IT professionals who argue that developers have expertise and abilities that should not be too quickly shoved aside. (Ironically, these same developers may be quick to use these tools themselves to make themselves more productive, further putting downward pressure on the staffing ratio.) The fact remains that the practices around development inside enterprises are changing and will continue to change in the coming years.
Also, application maintenance and ongoing support activities are getting pulled in two directions. While the number and types of applications managed by the IT organization continue to rise, technology, best practices, commercial software, and SaaS are making software maintenance easier. Largely because of SaaS and agile development practices, in the long term, we would expect a continuing slow decline of application maintenance work as a distinct job function. But because the footprint of business applications is becoming wider, we would not expect a smooth ride. Fluctuations will continue as organizations attempt to meet the challenges of digital transformation.
“App developers are expensive, and there is a shortage of talent for the latest programming languages,” said Tracell Frederick, research analyst for Avasant Research, based in Los Angeles. “It is no surprise that organizations are looking for ways to make their software developers more productive.”
In light of these trends, what is the typical application development staffing level today? Our full report uses three metrics to make that assessment: application developers as a percentage of the IT staff, users per application developer, and applications per developer. We provide benchmarks for the composite sample, by organization size, and by sector. We also provide a benchmark for the larger application group, which also includes personnel engaged in web development and support, quality assurance and testing, data management, business systems analysis, and DevOps.
This Research Byte is a brief overview of our report on this subject, Application Developer Staffing Ratios. The full report is available at no charge for subscribers, or it may be purchased by non-clients directly from our website (click for pricing).