The size of the application development and maintenance staff employed by the typical organization appears to be in decline, at least as a percentage of the IT staff.
As defined in our study, Application Development and Maintenance Staffing Ratios, this function comprises application programmers and system analysts, who design, analyze, code, test, and maintain application software. The category does not include system programmers, who are responsible for maintaining operating systems and other lower-level software in the IT infrastructure.
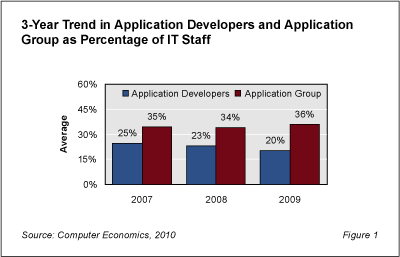
As shown in Figure 1, application programmers and system analysts declined from 25% of the IT staff on average in 2007 to 20% in 2009, based on our annual survey of more than 200 IT organizations each year.

Because organizations categorize functions differently, we also grouped application programmers and systems analysts with quality assurance and testing personnel, web/e-commerce staff, data warehouse and business intelligence staff, and business analysts to form a larger “application group.†Figure 1 shows this larger group has been constant over the past three years, at 34% to 36% of the IT staff. It is clear that the decline in application programmers and system analysts over the three-year period was offset by growth in related functions, especially business analysts and business intelligence personnel.
The recession, which caused a reduction in capital investment and new systems development, is certainly influencing the decline among application programmers and system analysts. Staff reductions, however, occurred across all categories and we believe there may be some longer-term trends at work, including the effects of outsourcing, reduction in custom development work, shifting of personnel to more specialized functions, and other factors that have been changing the IT staffing mix over time.
What is the ideal staffing level? The full study is designed to help IT managers determine whether their organizations are keeping pace with the industry by comparing their application staffing against industry benchmarks. We assess two basic metrics: application personnel as a percentage of the IT staff, and the number of users per application staff member. We provide benchmarks for the composite sample, by organization, and by sector. Other data shows the three-year trend in the staffing of this function and the influence of outsourcing on staffing ratios.
Because application development and maintenance consumes such a large portion of the IT budget, IT executives need to ensure their organizations are keeping pace with efficiency gains and changes occurring in this important area. Current trends in application development and maintenance can have a major influence on an organization’s ability to reinvest in new systems.
This Research Byte is a brief overview of our report on this subject, Application Development and Maintenance Staffing Ratios. The full report is available at no charge for Computer Economics clients, or it may be purchased by non-clients directly from our website (click for pricing).
Do you also need staffing ratios for other IT job functions? Consider this collection of all of our staffing ratio reports, which bundles them all into a single report at a significant discount: IT Staffing Ratios–Special Report Bundle.

