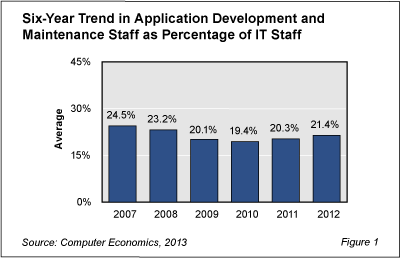
Over the past decade, the number of application programmers employed as a percentage of the typical IT organization has been falling, due to declining use of mainframes and rising use of commercial software and outsourcing services. However, in the short term, renewed capital spending and investment in enterprise and mobile applications is causing the size of the staff dedicated to developing and maintaining applications to rise again.
The growth in programmers as a percentage of the IT staff is slight but steady. As shown in Figure 1 from our study, Application Development and Maintenance Staffing Ratios, the recession prompted organizations to lay off application developers in greater numbers than other IT positions during the downturn. Application programmers declined from 24.5% of the IT staff in 2007 to 19.4% in 2010. The study also shows that application development and maintenance staff began to recover in 2011 as organizations renewed project work and investment in enterprise systems.

While far from returning to precession levels, programmers and system analysts have recovered a full percentage point since the bottom in 2010. In addition to the effect of the recession on capital spending there are longer-term trends at work that could dampen requirements for programmers. On the other hand, organizations are actively developing mobile applications, expanding ERP platforms, and making greater use of business intelligence systems, and it is not clear whether application developers will continue a longer-term decrease relative to other functional groups. In addition to developing applications, enterprises need programmers to maintain systems, provide technical support, and modify existing systems. Programmers remain a key element of nearly every IT organization.
With the changing environment, the need for programmers will remain in flux. What is the typical staffing level today? The full study uses three benchmarks to make that assessment: application development and maintenance staff as a percentage of the IT staff, users per application development and maintenance staff member, and applications per application development and maintenance staff member. We provide benchmarks for the composite sample, by organization, and by sector. We also provide benchmarks for the larger Application Group, which includes personnel engaged in web development and support, quality assurance and testing, data management, and business systems analysis.
This Research Byte is a brief overview of our report on this subject, Application Development and Maintenance Staffing Ratios. The full report is available at no charge for Computer Economics clients, or it may be purchased by non-clients directly from our website (click for pricing).
Do you also need staffing ratios for other IT job functions? Consider this collection of all of our staffing ratio reports, which bundles them all into a single report at a significant discount: IT Staffing Ratios–Special Report Bundle.

