Computer Economics recently conducted a survey of IT security professionals and managers on the frequency and economic impact of malware attacks on their organizations in the previous 12 months. Analysis of the survey results has been completed and is available in our special publication, the 2007 Malware Report: The Economic Impact of Viruses, Spyware, Adware, Botnets, and Other Malicious Code. The full report provides estimates of malware damages worldwide, at the organizational level, and at the level of individual malware events.
Worldwide Economic Impact of Malware
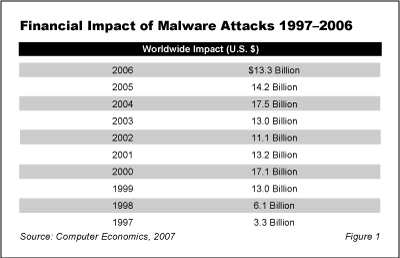
The study found that for the second year in a row, malware cost damages declined worldwide, as shown in Figure 1. In 2006, direct damages fell to $13.3 billion, from $14.2 billion in 2005, and $17.5 billion in 2004.

In this study, direct costs are defined as labor costs to analyze, repair and cleanse infected systems, loss of user productivity, loss of revenue due to loss or degraded performance of system, and other costs directly incurred as the result of a malware attack. Direct costs do not include preventive costs of antivirus hardware or software, ongoing personnel costs for IT security staff, secondary costs of subsequent attacks enabled by the original malware attack, insurance costs, damage to the organization’s brand, or loss of market value.
The two-year decline in direct cost damages is primarily the result of two trends:
- Anti-malware technology is becoming more widely deployed and is fairly effective in defending against many types of malware threats. Virtually all business computers are protected by antivirus systems, either at the desktop or at the firewall, or both. Even the majority of PCs sold to consumers include anti-virus software as a standard feature. As soon as malware authors create a new virus, or a new variant to exploit new vulnerabilities, vendors respond with new antivirus signatures, which are quickly downloaded to customer machines through subscription plans. Therefore, new attacks do not have the time they used to have to propagate and develop into massive worldwide infections with billions of dollars of damages in a single attack.
- The goal of malware authors has shifted over the past several years. Cyber-criminals today are motivated more by a desire to gain financially than to create havoc. Instead of releasing malware as a form of electronic vandalism, they design malicious code to quietly use infected machines to accomplish their objectives, such as sending spam, stealing credit card numbers, perpetuating click-fraud, displaying advertisements, or providing a backdoor into the organization’s network.
The second factor, above, implies that although direct damages of malware may be declining, the indirect or secondary damages are likely increasing. For example, a spyware attack may cost a few thousand dollars in damages, mostly in terms of the labor cost required to remove it from desktop machines. But if the spyware allows the hacker to sniff a user’s password, which he then uses to infiltrate the organization’s network, the secondary damages resulting form the unauthorized access could be devastating.
The increase in indirect and secondary damages may explain why, in spite of the slight decline in direct damages, our survey respondents indicate that the malware threat has grown worse over the past year.
Other Major Findings
The full report includes 36 graphs and tables providing detailed statistics on the frequency and economic impact of malicious code. Major findings include the following:
- At the median, organizations experience five malware events per year. This figure rises to 10 events per year for organizations with over 5,000 desktop computers. The full report provides details on the financial impact of these events for small, medium, and large organizations.
- On average, organizations consider malware a moderate to major threat, and the threat level has increased in the past 12 months. This is in spite of the investments that organizations have made in anti-malware technology.
- Although most organizations track the frequency of malware attacks, most do not formally track the economic impact of these events. Damages, therefore, can only be estimated based on reasonable assumptions for the scope and extent of each attack.
- Not surprisingly, the economic impact of malware events increases as organizational size increases. However, the impact of malware events varies widely between organizations according to the level of defenses implemented.
- Email is the most common vector for malware infection, followed by browsing malicious websites and infected PCs/laptops joining the network.
- Destructive viruses cause the greatest direct economic impact of any category of malware.
- Spyware and hacker tools are perceived as the two most serious types of malware threats facing organizations, even though their direct economic impact is smaller that that of destructive viruses.
- Spyware is the only category of malware where there is a clear consensus that the threat level is increasing. On average, respondents view the threat levels of other categories of malware as about the same as last year.
- Botnet infections are rare within organizations, leading to probable under-appreciation of the seriousness of the threat.
June 2007
This Research Byte is a small excerpt from our recent study, the 2007 Malware Report: The Economic Impact of Viruses, Spyware, Adware, Botnets, and Other Malicious Code, which is widely referenced in the business press as a source of information regarding the worldwide economic impact of malware on business. Business and IT executives will find this study a valuable source of economic statistics for justifying new IT security investments and anti-malware initiatives.
For more details on the 2007 Malware Report, please refer to the extended report description for a full table of contents and list of figures.
The 2007 Malware Report is available for purchase on our website at https://avasant.com/report/2007-malware-report-the-economic-impact-of-viruses-spyware-adware-botnets-and-other-malicious-code/ (click for pricing).

