
Areas of Interest
Content Type
Industries
- Aerospace and defense
- Banking, Financial Services, and Insurance
- Energy and Resources
- Federal Government
- Healthcare and life sciences
- High-tech and telecommunications
- Higher Education
- Media and entertainment
- Private equity
- Public Sector
- Retail and manufacturing
- Social Impact Institutions
- Travel and transportation
Technologies
- Artificial Intelligence
- Automation
- Blockchain
- Business and data analytics
- Cloud
- Customer relationship management (CRM)
- Cybersecurity
- Digital Services
- Enterprise resource planning (ERP)
- Human capital management (HCM)
- Internet Of Things
- Machine Learning
- Networking
- Supply chain management (SCM)
- Virtual reality/Augmented reality
Areas of Interest
Latest Reports
Intelligent Automation Services 2025–2026 RadarView™
The Intelligent Automation Services 2025–2026 RadarView™ assists organizations in identifying strategic partners for intelligent automation services by offering detailed capability and experience analyses of service providers. It provides a 360-degree view of key intelligent automation service providers across the dimensions of practice maturity and future proofing, thereby supporting enterprises in identifying the right service partner. The 74-page report highlights top supply-side trends in the intelligent automation space and Avasant’s viewpoint on them.

Intelligent ITOps Services 2025-2026 Market Insights™
The Intelligent ITOps Services 2025 Market Insights™ assists organizations in identifying important demand-side trends that are expected to have a long-term impact on any intelligent ITOps projects. The report also highlights key challenges that enterprises face today.
Intelligent ITOps Services 2025-2026 RadarView™
The Intelligent ITOps Services 2025 RadarView™ assists organizations in identifying strategic partners for intelligent ITOps by offering detailed capability and experience analyses of service providers. It provides a 360-degree view of key intelligent ITOps service providers across practice maturity and future proofing, thereby supporting enterprises in identifying the right intelligent ITOps services partner. The 77-page report also highlights top market trends in the intelligent ITOps space and Avasant’s viewpoint on them.
Intelligent ITOps Services: Providers Scale AI-led Platforms to Strengthen IT Resilience and Autonomous Operations
Cross-domain orchestration needs and fragmented application environments have shifted enterprise ITOps toward stronger IT service and application management foundations. Enterprises are now using generative AI and AI agents to streamline incident handling, improve diagnostics, and support more consistent service quality. At the same time, rising observability and security gaps across cloud, application, and network layers are accelerating investments in AIOps, AI-native security operations, and SRE-led orchestration to maintain control across distributed environments. Both demand- and supply-side trends are covered in Avasant’s Intelligent ITOps Services 2023–2024 Market Insights™ and Intelligent ITOps Services 2023–2024 RadarView™, respectively.
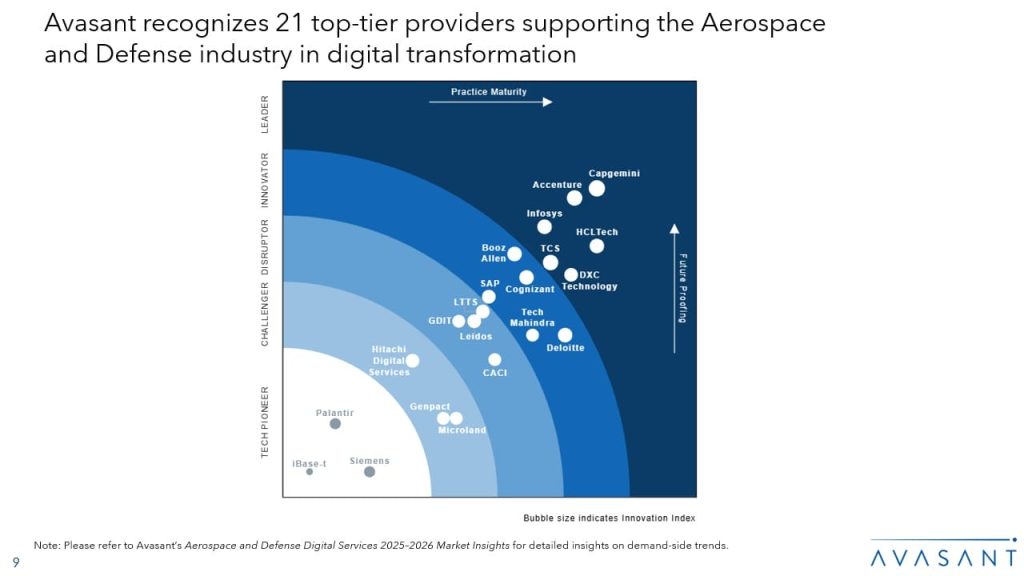
Shifting Aerospace and Defense Industry Toward Platform-led, AI-Enabled, and Compliance-First Transformation
Aerospace and Defense enterprises are expanding their global production capacity and reshoring critical manufacturing in response to rising defense spending, geopolitical pressures, and sovereign sourcing requirements. At the same time, digital engineering, AI, and digital twins are moving from pilots to production across manufacturing, testing, MRO, and sustainment, making model-based and digitally validated workflows standard across the life cycle. Enterprises are also shifting toward modular delivery and technology-enabled operating models, increasingly favoring platform-, automation-, and AI-led solutions and evaluating service providers and technology vendors together to achieve faster, scalable, and more resilient outcomes. Both demand- and supply-side trends are covered in Avasant’s Aerospace and Defense Digital Services 2025–2026 Market Insights™ and Aerospace and Defense Digital Services 2025–2026 RadarView™, respectively.

Media and Entertainment Digital Services 2025–2026 Market Insights™
The Media and Entertainment Digital Services 2025–2026 Market Insights™ assists organizations in identifying important demand-side trends that are expected to have a long-term impact on any digital project in the media and entertainment industry. The report also highlights key challenges that enterprises face today.
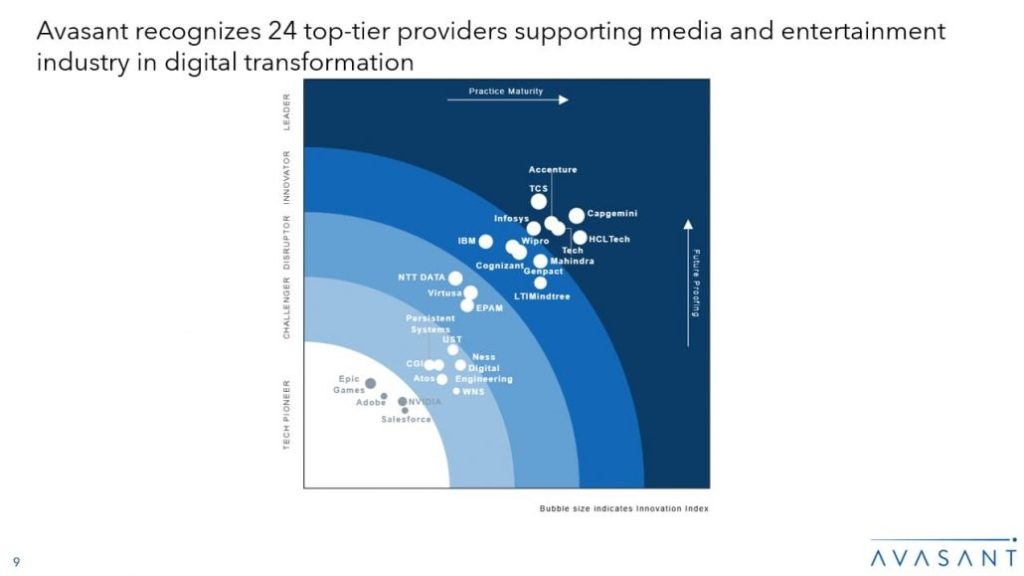
Personalization, Privacy, and Immersive Experiences: Turning Disruption into Opportunity for Content, Commerce, and Connection
The media and entertainment industry is being reshaped as AI becomes embedded across core operations, powering content creation, editing, recommendations, advertising, and compliance, while unified models enable real-time personalization across platforms. As privacy regulations tighten and third-party cookies decline, enterprises are prioritizing first-party data, secure data architectures, and strong consent frameworks to maintain trust and compliance. Monetization is shifting toward ad-supported streaming, free ad-supported streaming television (FAST) channels, and retail media, driving the convergence of content, commerce, and advertising through shoppable formats and retail partnerships. At the same time, rising competition and costs are accelerating the bundling, aggregation, and consolidation of services, with alliances and mergers enhancing scale, resilience, customer experience, and retention. Interactive engagement through gaming, esports, AR/VR, and phygital experiences is becoming central to strategy, supported by stronger verification, content provenance, IP protection, and fraud controls to ensure sustainable, brand-safe growth. Both demand- and supply-side trends are covered in Avasant’s Media and Entertainment Digital Services 2025–2026 Market Insights™ and Media and Entertainment Digital Services 2025–2026 RadarView™, respectively.
Media and Entertainment Digital Services 2025-2026 RadarView™
The Media and Entertainment Digital Services 2025–2026 RadarView™ helps media and entertainment enterprises craft a robust strategy based on industry outlook, best practices, and digital transformation. The report can also aid them in identifying the right partners and service providers to accelerate their digital transformation in this space. The 91-page report also highlights top market trends in the media and entertainment space and Avasant’s viewpoint.

CPG Digital Services 2025–2026 Market Insights™
The CPG Digital Services 2025–2026 Market Insights™ assists organizations in identifying important demand-side trends that are expected to have a long-term impact on any digital project in the CPG industry. The report also highlights key challenges that enterprises face today.
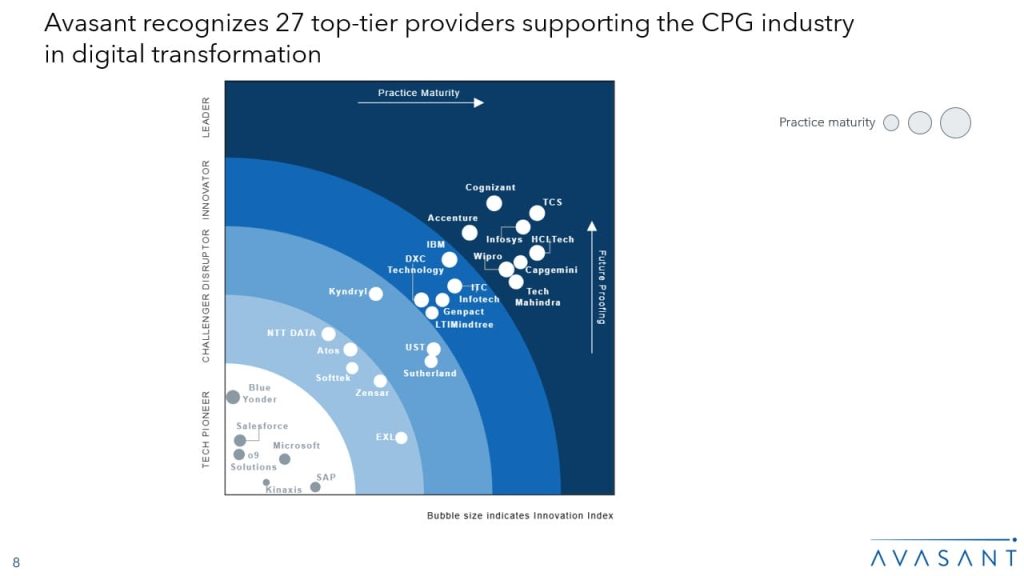
Driving Intelligent, Connected, and Sustainable CPG Growth Through Advanced Digital Capabilities
Consumer packaged goods (CPG) enterprises are redesigning their operating models around AI-first intelligence to optimize portfolios, automate decisions, and modernize production. They are recalibrating their global supply bases in response to tariff volatility, using digital twins, AI, and predictive analytics to diversify sourcing and strengthen resilience. To protect margins, firms are reshaping go-to-market strategies, scaling retail media, and reallocating spend to high-ROI channels. Manufacturing operations are shifting toward autonomous, predictive systems powered by IoT, robots, and AI maintenance. Real-time demand sensing is being adopted to mitigate stockouts, improve pricing, and prevent revenue leakage. Additionally, sustainability expectations are accelerating the adoption of circular packaging and low-footprint product models across the value chain.