Home » All Reports » Page 15
Areas of Interest
Content Type
Industries
- Aerospace and defense
- Banking, Financial Services, and Insurance
- Energy and Resources
- Federal Government
- Healthcare and life sciences
- High-tech and telecommunications
- Higher Education
- Media and entertainment
- Private equity
- Public Sector
- Retail and manufacturing
- Social Impact Institutions
- Travel and transportation
Technologies
- Artificial Intelligence
- Automation
- Blockchain
- Business and data analytics
- Cloud
- Customer relationship management (CRM)
- Cybersecurity
- Digital Services
- Enterprise resource planning (ERP)
- Human capital management (HCM)
- Internet Of Things
- Machine Learning
- Networking
- Supply chain management (SCM)
- Virtual reality/Augmented reality
Areas of Interest
Latest Reports

Policy Harmonization for IT Procurement: Alignment Across Entities
Despite the European Union’s push for smarter procurement, over 55% of public tenders still prioritize price alone—leaving innovation and sustainability on the sidelines. This signals a pressing need for harmonized IT procurement policies that unlock broader strategic value. When aligned across entities, IT procurement policies can deliver powerful outcomes: cost savings, lower compliance risks, streamlined operations, and accelerated innovation. For organizations operating across diverse structures—whether multinational corporations, government agencies, or academic institutions—policy harmonization isn’t just beneficial, it’s essential.

Unlocking Efficiencies for AI Implementation in Procurement Optimization
By the end 2025, over 60% of procurement decisions will be influenced by AI, yet most organizations still struggle to implement it effectively. Procurement leaders face a paradox: Artificial Intelligence promises transformation, but only when implemented with surgical precision. The hype is over—AI is now a board-level mandate actively reshaping how procurement functions, but turning promise into performance demands more than interest; it requires executive clarity. In our last article, we explored how AI creates value. This time, we’re focused on how to unlock it. From fragmented data and compliance constraints to change resistance and misaligned processes, the road to AI success is lined with pitfalls. What separates the leaders is a practical, people-first approach—one that aligns technology with business goals, ensures stakeholder trust, and delivers measurable impact.

Broadcom–VMware Shake-up: Rising Costs, Subscription Shock, and Enterprise Response
Broadcom’s overhaul of VMware’s licensing and pricing models has sent shockwaves through global IT budgets. This Research Byte from Avasant examines how the shift to subscription-only models is driving cost escalation and operational challenges for enterprises, universities, and partners. More importantly, it highlights how forward-looking organizations are using this moment to realign their sourcing strategies, strengthen negotiation leverage, and modernize their virtualization environments. Backed by Avasant’s deep sourcing intelligence and client case studies, the article reveals how disruption can become a catalyst for transformation.

Business Process Services – Provider Trends CQ2 2025
In this quarterly report for CQ2 2025, Avasant provides key information on trends in the business process services (BPS) space. It covers facts and figures about service providers (including revenue and resource trends), macro trends, and executive sentiment from the service provider community. In this quarterly report, we cover 12 pure-play BPS providers or providers with BPS as a primary offering and all industry verticals and markets. The report covers trends across a gamut of business process services, including finance and accounting, hire-to-retire, supply chain and procurement, customer experience, and industry-specific services. The geographic coverage for the report is global, with a larger share of data points from North America. The report builds on insights gathered through ongoing market research, data collection, and proprietary databases. It includes market data from providers accessed through multiple sources, such as public disclosures and market interactions.

Capacity Wars: Securing GPU’s Without Paying Scarcity Premiums
As AI infrastructure demand surges, organizations face unpredictable scarcity premiums on GPUs and compute resources. These premiums spike during chip launches, regional power constraints, and sudden model feature changes. Instead of overpaying for priority access, enterprises should adopt a “capacity ladder” strategy, diversifying reservations across chip classes, regions, and providers, with pre-agreed substitution rights and pricing step-downs. Avasant’s AI Contract Intelligence framework enables organizations to secure throughput, avoid scarcity premiums, and future-proof their AI sourcing by embedding laddered reservations, chip-class equivalency, and dual-provider orchestration into contracts. The result: predictable costs, assured capacity, and resilience against supply shocks.

IT and Apps Managed Services Provider Trends: Quarterly Report for CQ2 2025
In this quarterly report (calendar quarter 2, 2025), Avasant provides key information on IT and apps managed services provider trends. The report covers key information on the IT services industry and the provider ecosystem. It covers the service provider facts and figures (including revenue and resource trends) and executive sentiment from the service provider community. The report covers trends across a gamut of IT services, including but not limited to IT infrastructure, application, and end-user services. The geographic coverage for the report is global. It builds on insights gathered through ongoing market research, data collection, and proprietary databases. It includes market data from providers accessed through multiple sources such as public disclosures, market interactions, and deals data.

Digital CX Services 2025 Market Insights™
The Digital CX Services 2025 Market Insights™ assist organizations in identifying important demand-side trends that are expected to have a long-term impact on any digital CX transformation projects. The report also highlights key digital CX transformation challenges that enterprises face today.

Digital CX Services: Driving Scalable, Adaptive CX with Agentic AI Orchestration
Enterprises are increasingly prioritizing the modernization of customer service operations and the optimization of marketing workflows. Evolving global regulations on data privacy, cross-border data transfers, and AI governance are driving demand for compliant, secure, and interoperable digital CX solutions. However, challenges continue to persist in enterprise digital CX adoption due to organizational silos, legacy systems, data complexity, and weak governance. Service providers are addressing these challenges by investing in proprietary platforms, forming strategic partnerships, embedding AI into workflows, and delivering scalable, omnichannel, and personalized CX. They are also advancing from generative AI augmentation to autonomous agentic AI orchestration, deploying domain-specific agents to improve CX workflows.

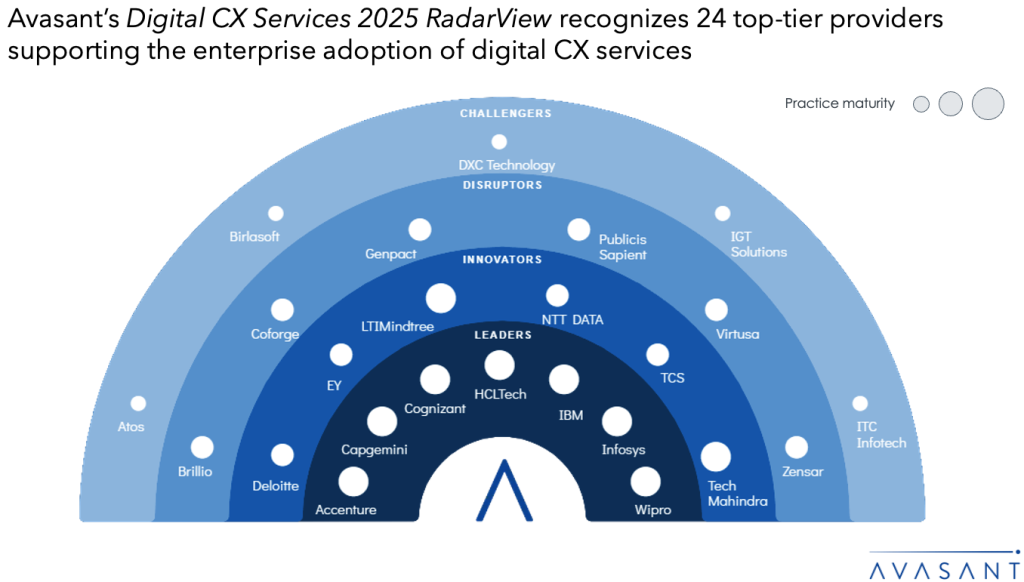
Digital CX Services 2025 RadarView™
The Digital CX Services 2025 RadarView™ assists organizations in identifying strategic partners for digital CX services by offering detailed capability and experience analyses for service providers. It provides a 360-degree view of key digital CX service providers across practice maturity, partner ecosystem, and investments and innovation, thereby supporting enterprises in identifying the right digital CX services partner. The 71-page report highlights top supply-side trends in the digital CX services space and Avasant’s viewpoint on them.

Vendor Discount Report October 2025
The largest and best discounts are often only offered to the vendors’ best customers, and buyers may find it difficult to determine whether the discount offered is typical or whether a better deal can be negotiated. The Vendor Discounts Report is designed to give procurement personnel, lessors, lessees, and departmental manager’s insight and guidance regarding current discount structures on a variety of categories of equipment in the marketplace.


