
Areas of Interest
Content Type
Industries
- Aerospace and defense
- Banking, Financial Services, and Insurance
- Energy and Resources
- Federal Government
- Healthcare and life sciences
- High-tech and telecommunications
- Higher Education
- Media and entertainment
- Private equity
- Public Sector
- Retail and manufacturing
- Social Impact Institutions
- Travel and transportation
Technologies
- Artificial Intelligence
- Automation
- Blockchain
- Business and data analytics
- Cloud
- Customer relationship management (CRM)
- Cybersecurity
- Digital Services
- Enterprise resource planning (ERP)
- Human capital management (HCM)
- Internet Of Things
- Machine Learning
- Networking
- Supply chain management (SCM)
- Virtual reality/Augmented reality
Areas of Interest
Latest Reports
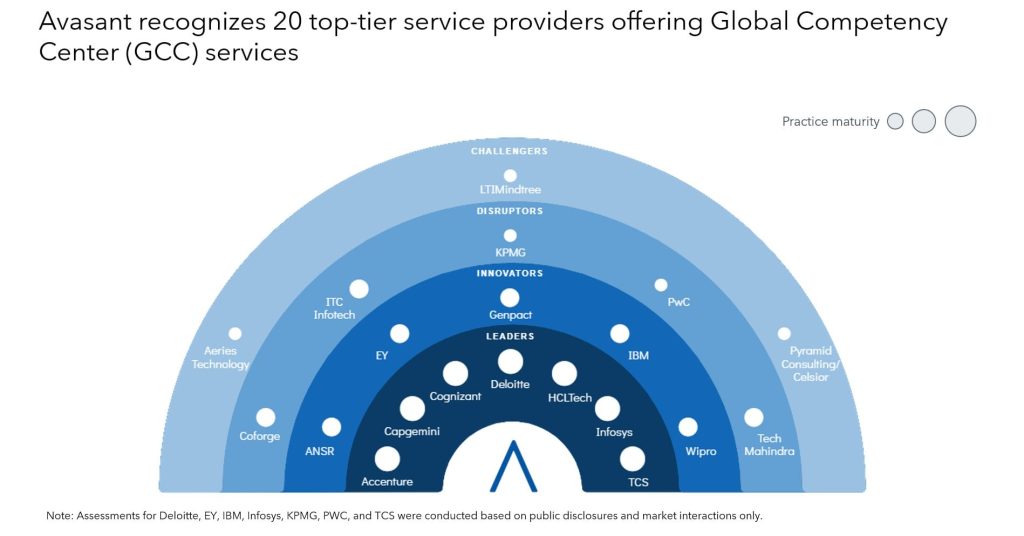
Global Competency Center (GCC) Services: Enhancing Control, Digital Adoption, and Driving Innovation
Over the past three years, GCCs have grown rapidly, with India offering significant untapped potential. As they mature, GCCs are becoming strategic assets for monetization, increasingly focusing on innovation and driving demand for digital and ER&D talent and hence, paving the way for innovation hubs. Additionally, collaborations between GCCs and service providers are on the rise, enabling quick scaling of operations and fostering stable partnerships. This evolution offers a clear view of the evolving GCC landscape, emerging opportunities, and the strategic value GCCs can unlock through transformation and innovation.
Global Competency Center (GCC) Services 2025 RadarView™
The Global Competency Center Services 2025 RadarView™ helps enterprises craft a robust strategy for GCC services based on industry outlook and best practices. The report can also aid them in identifying the right partners and service providers to accelerate their GCC journey across the value chain. The 62-page report also highlights top market trends in the GCC services space and Avasant’s viewpoint.

Multisourcing Service Integration 2025 Market Insights™
The Multisourcing Service Integration 2025 Market Insights™ assists organizations in identifying important demand-side trends that are expected to have a long-term impact on any MSI project. The report also highlights MSI challenges that enterprises face today.
Advancing MSI Outcomes with Experience-Centric Delivery and Generative AI
Organizations are shifting their approach to multisourcing service integration (MSI), moving from vendor coordination management toward facilitating experience-focused delivery, cross-domain service management, and agile, product-oriented transformation. However, they continue to face persistent challenges such as unclear ownership of cross-supplier processes, fragmented SLAs, and a lack of interoperability across platforms and tools. Service providers are addressing these gaps by embedding experience-level agreements into MSI engagements. They are also enhancing responsiveness and improving service outcomes by leveraging generative AI and agentic AI to automate incident resolution, streamline orchestration, and deliver real-time insights.

From Operational Silos to Intelligent Retail Engines: How Autonomous AI and Retail Media Networks are Redefining Retail in 2025
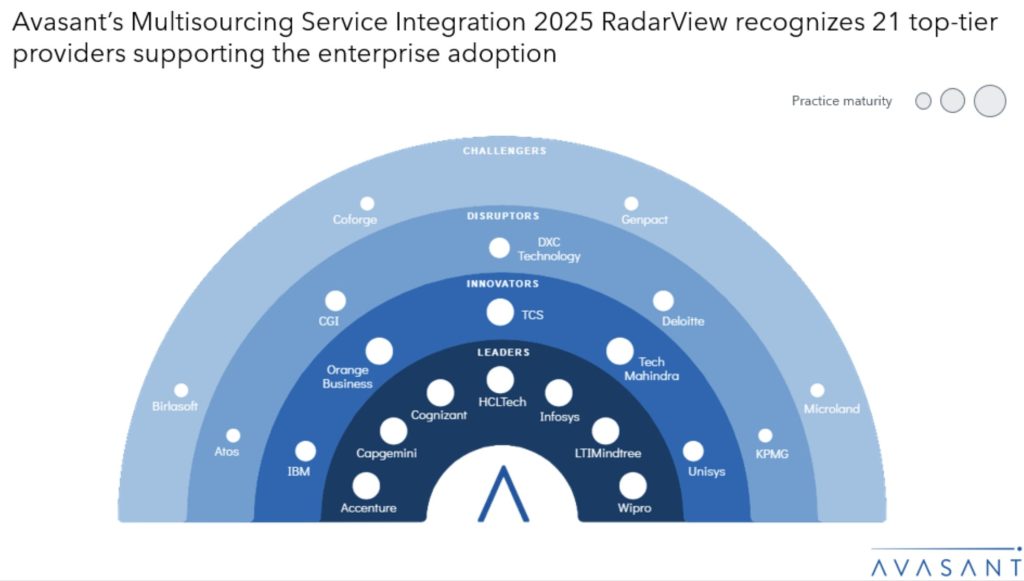
Multisourcing Service Integration 2025 RadarView™
The Multisourcing Service Integration 2025 RadarView™ assists organizations in identifying strategic partners for MSI by offering detailed capability and experience analyses for service providers. It provides a 360-degree view of key MSI service providers across practice maturity, partner ecosystem, and investments and innovation, thereby supporting enterprises in identifying the right MSI services partner. The 65-page report highlights top supply-side trends in the MSI space and Avasant’s viewpoint on them.

Molecular Innovation with AI: The Future of Drug Discovery
AI is transforming drug discovery by boosting early-stage clinical trial success rates to 80%–90%, compared to the traditional 40%–65%, and contributing to nearly half of preclinical drug development output. Leveraging big data and advanced deep learning models, AI accelerates target identification, molecular design, and clinical trial optimization, saving millions in costs and months in timelines. Notable breakthroughs include AI-designed antibodies and drug repositioning successes. This article explores how, despite challenges such as data quality and transparency, combining AI with ethical oversight and collaboration promises faster, more precise, and patient-focused pharmaceutical innovation.

Beyond Contracts: Elevating Vendor Oversight Through Management and Governance
In today’s risk-intensified and hyper-connected environment, enterprises can no longer rely on traditional, contract-focused vendor oversight. As third-party ecosystems become strategic enablers of innovation and resilience, organizations must shift toward an integrated approach that combines tactical vendor management with proactive governance. This paper explores how a unified oversight model can enhance risk mitigation, regulatory compliance, and long-term value creation. With tighter regulations and advanced digital tools and AI, best-in-class oversight turns vendors into strategic partners who deliver clear results, increase agility, and boost long-term performance for the enterprise.

Financial Services Digital Services 2025 Market Insights™
The Financial Services Digital Services 2025 Market Insights™ assists organizations in identifying important demand-side trends that are expected to have a long-term impact in the future for any digital projects in the financial services space. The report also highlights key challenges that enterprises face today.
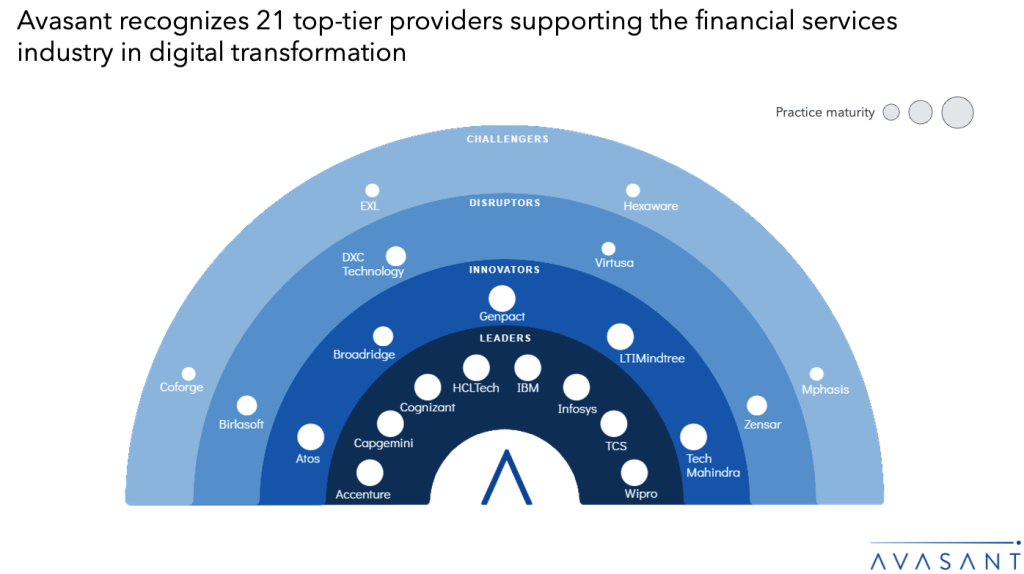
Accelerating Innovation and Navigating Change in the Financial Services Landscape
The financial services industry is undergoing significant changes due to a combination of structural and market forces. These include a rising demand for hybrid advisory models, an increase in digital assets, ongoing margin compression in investment banks, the acceleration of T+1 settlement mandates across Europe, and a growing focus on sustainable investment strategies. In response to these challenges, companies are integrating AI and advanced analytics into their core operations, adopting blockchain and tokenization to access new asset classes, expanding cloud infrastructure and data platforms for greater agility, and implementing AI-driven solutions for compliance and cybersecurity. Together, these efforts are creating a new standard for personalized, resilient, and efficient financial services. Both demand-side and supply-side trends are covered in our Financial Services Digital Services 2025 Market Insights™ and Financial Services Digital Services 2025 RadarView™, respectively.