-
![European IT Spending and Staffing Benchmarks 2021/2022: Chapter 11: IT Services and Solutions EUISS2021Ch11 - European IT Spending and Staffing Benchmarks 2021/2022: Chapter 11: IT Services and Solutions]()
European IT Spending and Staffing Benchmarks 2021/2022: Chapter 11: IT Services and Solutions
Chapter 11 provides IT spending and staffing statistics for the IT services and solutions sector. The category includes software companies, software-as-a-service (SaaS) providers, systems integrators, IT solution providers, business process outsourcing firms, and other providers of technology services and solutions. There are 19 organizations in the sample, ranging in size from around €50 million to about €10 billion in annual revenue.
September, 2021
-
![European IT Spending and Staffing Benchmarks 2021/2022: Chapter 5: Discrete Manufacturing EUISS2021Ch5 - European IT Spending and Staffing Benchmarks 2021/2022: Chapter 5: Discrete Manufacturing]()
European IT Spending and Staffing Benchmarks 2021/2022: Chapter 5: Discrete Manufacturing
Chapter 5 provides benchmarks for discrete manufacturing organizations. Discrete manufacturers are defined as those where the production process adds value by fabricating or assembling individual (discrete) unit production. The category includes manufacturers of consumer products, industrial equipment, telecommunications equipment, aerospace products, auto parts, electrical parts, medical devices, and electronic devices, among other products. The 32 respondents in this sample range in size from a minimum of €74 million to over €70 billion in annual revenue.
September, 2021
-
![European IT Departments More Cautious Than American Counterparts Fig1 1 - European IT Departments More Cautious Than American Counterparts]()
European IT Departments More Cautious Than American Counterparts
The best way to describe the European recovery from the COVID-19 pandemic is cautiously optimistic. Maybe with a little extra emphasis on optimistic. But it is nothing quite like the miracle recovery we described a little over a month ago for IT organizations in the US and Canada. Still, it is not all bad. In Europe, we continue to see expected increases in spending on digital transformation, software as a service (SaaS), and cloud, indicating that IT organizations are not holding back on new investments, and they see a clear path toward a digital future. This research byte is a brief description of some of the findings in our European IT Spending and Staffing Benchmarks 2021/2022 study.
September, 2021
-
![European IT Spending and Staffing Benchmarks 2021/2022: Chapter 8: Wholesale Distribution EUISS2021Ch8 - European IT Spending and Staffing Benchmarks 2021/2022: Chapter 8: Wholesale Distribution]()
European IT Spending and Staffing Benchmarks 2021/2022: Chapter 8: Wholesale Distribution
Chapter 8 provides benchmarks for wholesale distributors. The category includes wholesale distributors of building products, home furnishings, home improvement products, auto parts, industrial components, electronics, food and beverage, and other products. The 15 respondents in the sample range in size from a minimum of about €60 million to about €30 billion in revenue.
September, 2021
-
![European IT Spending and Staffing Benchmarks 2021/2022: Chapter 6: Financial Services EUISS2021Ch6 - European IT Spending and Staffing Benchmarks 2021/2022: Chapter 6: Financial Services]()
European IT Spending and Staffing Benchmarks 2021/2022: Chapter 6: Financial Services
Chapter 6 provides benchmarks for banking, insurance, and financial services companies. The firms in this sector include commercial banks, investment banks, credit unions, mortgage lenders, consumer finance lenders, insurance companies, and other types of lenders and financial services providers. The 21 respondents in this sector range in size from a minimum of about €100 million to a maximum of €80 billion in annual sales.
September, 2021
-
![European IT Spending and Staffing Benchmarks 2021/2022: Chapter 7: Retail EUISS2021Ch7 - European IT Spending and Staffing Benchmarks 2021/2022: Chapter 7: Retail]()
European IT Spending and Staffing Benchmarks 2021/2022: Chapter 7: Retail
Chapter 7 provides benchmarks for retailers. This sector includes retailers of clothing, hardware, furniture, sports equipment, groceries, pharmaceuticals, dietary supplements and health products, and general merchandise. They include department stores, furniture stores, pharmacies, sporting goods stores, and specialty retailers, both online and brick-and-mortar. We also include hospitality and consumer services in this sector. The 33 respondents in the sample range in size from €100 million to €27 billion in annual revenue.
September, 2021
-
![European IT Spending and Staffing Benchmarks 2021/2022: Chapter 9: Energy and Utilities EUISS2021Ch9 - European IT Spending and Staffing Benchmarks 2021/2022: Chapter 9: Energy and Utilities]()
European IT Spending and Staffing Benchmarks 2021/2022: Chapter 9: Energy and Utilities
Chapter 9 provides benchmarks for public utilities, oil and gas producers, service companies, and midstream distributors across all organization sizes. The 14 respondents in this sector include public utilities (water, gas, and electric), integrated energy companies, upstream exploration and production companies, natural gas companies, pipeline operators, and other energy and utilities companies. The companies in our sample range in size from a minimum of about €100 million to about €14 billion in annual revenue.
September, 2021
-
![European IT Spending and Staffing Benchmarks 2021/2022: Chapter 10: Professional and Technical Services EUISS2021Ch10 - European IT Spending and Staffing Benchmarks 2021/2022: Chapter 10: Professional and Technical Services]()
European IT Spending and Staffing Benchmarks 2021/2022: Chapter 10: Professional and Technical Services
Chapter 10 provides benchmarks for professional and technical services organizations. The 35 respondents in the sample range in size from a minimum of about €50 million to about €70 billion in annual revenue. The sector includes firms that provide professional and technical services, including engineering, legal, accounting, financial advice, consulting, marketing, research, IT, and other services.
September, 2021
-
![Data Classification and Retention Adoption and Best Practices 2021 dclassfig22021 - Data Classification and Retention Adoption and Best Practices 2021]()
Data Classification and Retention Adoption and Best Practices 2021
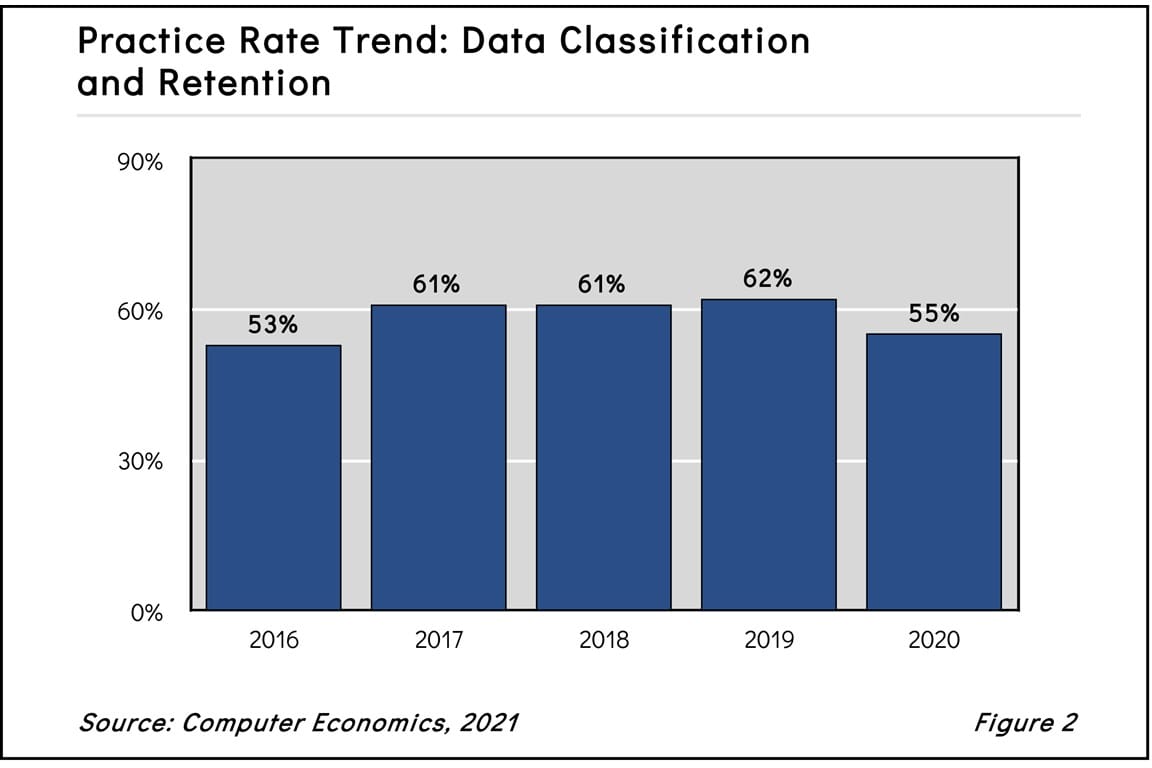
Creating a formal classification scheme is an important element in managing data for security, disaster recovery, and retention purposes. Yet, many organizations—even those that profess a commitment to protecting corporate and customer information—fail to implement data classification. This report begins by defining data classification and retention. We next study the adoption and practice levels and examine those by organization size and sector. We conclude with best-practice recommendations.
July, 2021
-
![European IT Spending and Staffing Benchmarks 2021/2022: Chapter 12: Food and Beverage EUISS2021Ch12 - European IT Spending and Staffing Benchmarks 2021/2022: Chapter 12: Food and Beverage]()
European IT Spending and Staffing Benchmarks 2021/2022: Chapter 12: Food and Beverage
Chapter 12 provides benchmarks for food and beverage manufacturers. The 17 respondents in the sample range in size from about €100 million to about €22 billion in annual revenue. Food and beverage companies produce beverages, snack foods, meat products, seafood products, vegetables, dairy products, dietary supplements, pet food, and other consumable food products. Some are suppliers to other food manufacturers or to the food service industry, while many also distribute consumer products to retailers or directly to consumers.
September, 2021
-
![Website Accessibility Adoption and Best Practices 2021 WebsiteAccessibility2021 - Website Accessibility Adoption and Best Practices 2021]()
Website Accessibility Adoption and Best Practices 2021
Website accessibility is a best practice requiring the use of inclusive website design to facilitate use by people with disabilities, including visual, hearing, motor skills, or cognitive impairment. When this practice is followed formally and consistently, the experience is improved for people with disabilities who can better understand, navigate, and interact with an organization’s websites. In this report, we study the adoption and practice levels for website accessibility and examine those by organization size and sector. We conclude with practical recommendations for getting started with website accessibility.
August, 2021


