
Areas of Interest
Content Type
Industries
- Aerospace and defense
- Banking, Financial Services, and Insurance
- Energy and Resources
- Federal Government
- Healthcare and life sciences
- High-tech and telecommunications
- Higher Education
- Media and entertainment
- Private equity
- Public Sector
- Retail and manufacturing
- Social Impact Institutions
- Travel and transportation
Technologies
- Artificial Intelligence
- Automation
- Blockchain
- Business and data analytics
- Cloud
- Customer relationship management (CRM)
- Cybersecurity
- Digital Services
- Enterprise resource planning (ERP)
- Human capital management (HCM)
- Internet Of Things
- Machine Learning
- Networking
- Supply chain management (SCM)
- Virtual reality/Augmented reality
Areas of Interest
Latest Reports
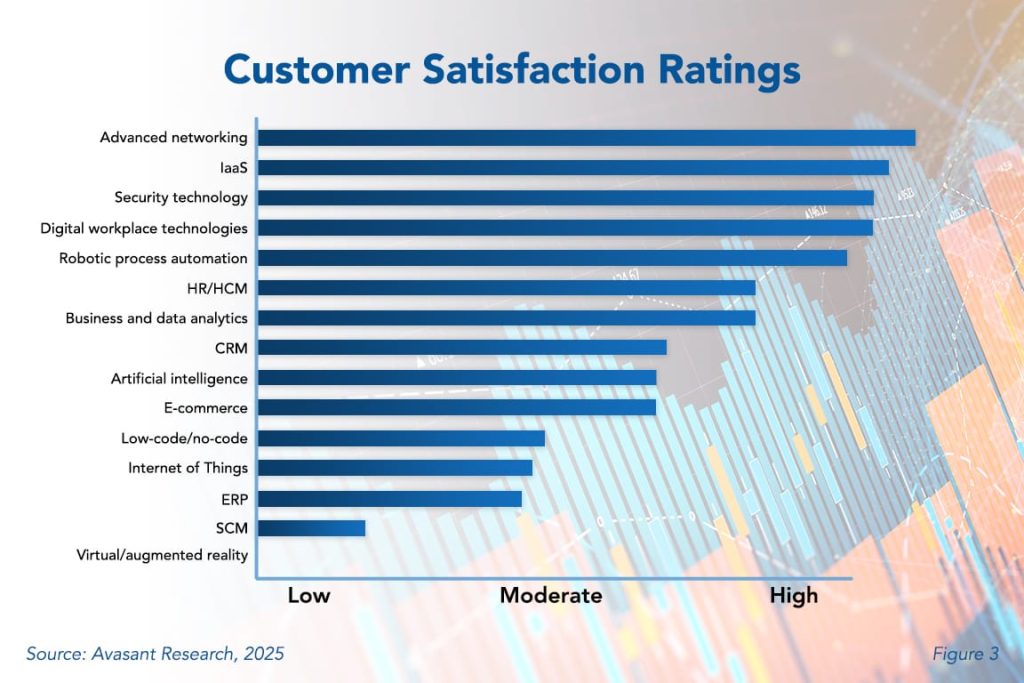
Worldwide Technology Trends 2025
This study is designed to give business leaders insights into the adoption, investment, and customer experience of 15 technologies in each category. It provides a glimpse into how quickly an emerging technology is being adopted, how deeply more established technologies penetrate the market, and how positively customers experience each of them. The study also delves into the specific types of solutions under consideration. By understanding adoption trends, investment activity, and customer experience, decision-makers are in a better position to assess the potential risks and rewards of investing in each of these technologies. They can also gain insights into just how aggressively competitors and peers are investing in them.

Strategic Evaluation of CRM Vendors’ AI Road Maps: An Executive Guide
Artificial Intelligence (AI) has fundamentally redefined the role of Customer Relationship Management (CRM) platforms. No longer confined to record-keeping, CRM platforms have evolved into predictive engines that drive personalization, operational efficiency, and customer loyalty. For executives and procurement leaders, the challenge is no longer whether to adopt AI, but how to select CRM vendors whose AI roadmaps align with long-term business strategy, governance, and regulatory requirements.

AI in Media: Solving the Challenges of Attention and Output
In an age where content is unlimited, but attention is scarce, media companies face a growing paradox: how to deliver stories that capture attention without drowning audiences in noise. At the same time, the pressure to produce content faster has intensified, particularly in journalism where deadlines often cut into depth. Together, these twin challenges—the demand for personalized engagement and the need for speed—have forced the industry to search for new solutions. Increasingly, the answer lies in artificial intelligence. Far from replacing creativity, AI is emerging as a tool to repurpose content, personalize experiences, and streamline production, allowing creators to focus on what matters most: telling stories that resonate. Industry leaders, including those speaking at Avasant’s “Empowering Beyond Summit,” have echoed this view—arguing that AI is becoming not a threat, but an enhancer of creativity (Avasant Summit Video, 2025).
Generative AI Services 2025 Market Insights™
The Generative AI Services 2025 Market Insights™ assists organizations in identifying important demand-side trends that are expected to have a long-term impact on any Gen AI project. The report also highlights key challenges that enterprises face today.
The Evolution of Service Providers from AI Enablers to Ecosystem Orchestrators
Enterprises are accelerating the adoption of generative AI to achieve measurable productivity gains, fueling growth in large-scale transformations and managed service deals. At the same time, many are developing proprietary large language models to enhance contextual accuracy, regulatory compliance, and data sovereignty. While automation-led functions are scaling rapidly, compliance-heavy areas continue to advance cautiously. In parallel, national investments in sovereign AI are strengthening domestic compute and data ecosystems, reinforcing the foundation for enterprise-grade AI maturity.
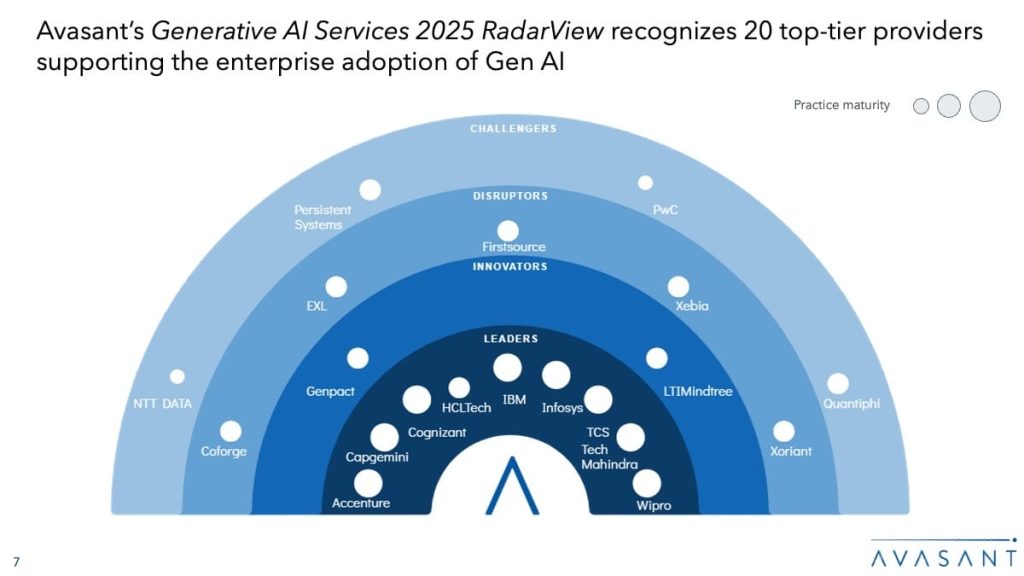
Generative AI Services 2025 RadarView™
The Generative AI Services 2025 RadarView™ assists organizations in identifying strategic partners for Gen AI adoption by offering detailed capability and experience analyses for service providers. It provides a 360-degree view of key Gen AI service providers across practice maturity, partner ecosystem, and investments and innovation, thereby supporting enterprises in identifying the right Gen AI services partner. The 64-page report highlights top supply-side trends in the Gen AI space and Avasant’s viewpoint.

Digital Engineering Services 2025–2026 Market Insights™
The Digital Engineering Services 2025–2026 Market Insights™ assists organizations in identifying important demand-side trends that are expected to have a long-term impact on any digital engineering project. The report also highlights key challenges that enterprises face today in the digital engineering space.
Digital Engineering Services: Accelerating Engineering Innovation and Value Creation Through Digital Technologies
Enterprises are responding to persistent economic headwinds by accelerating engineering life cycle optimization. AI-enabled engineering, cloud platforms, and digital twins are being adopted to sustain efficiency and competitiveness. As organizations build connected digital threads, securing data and assets has become critical, prompting the integration of cybersecurity frameworks and AI-driven threat management. Evolving customer expectations are also reshaping R&D priorities, with enterprises using analytics, generative AI, and AR/VR to deliver personalized and innovative products. At the same time, sustainability remains central, with digital technologies helping improve product design, reduce environmental impact, and optimize resource use for long-term growth.
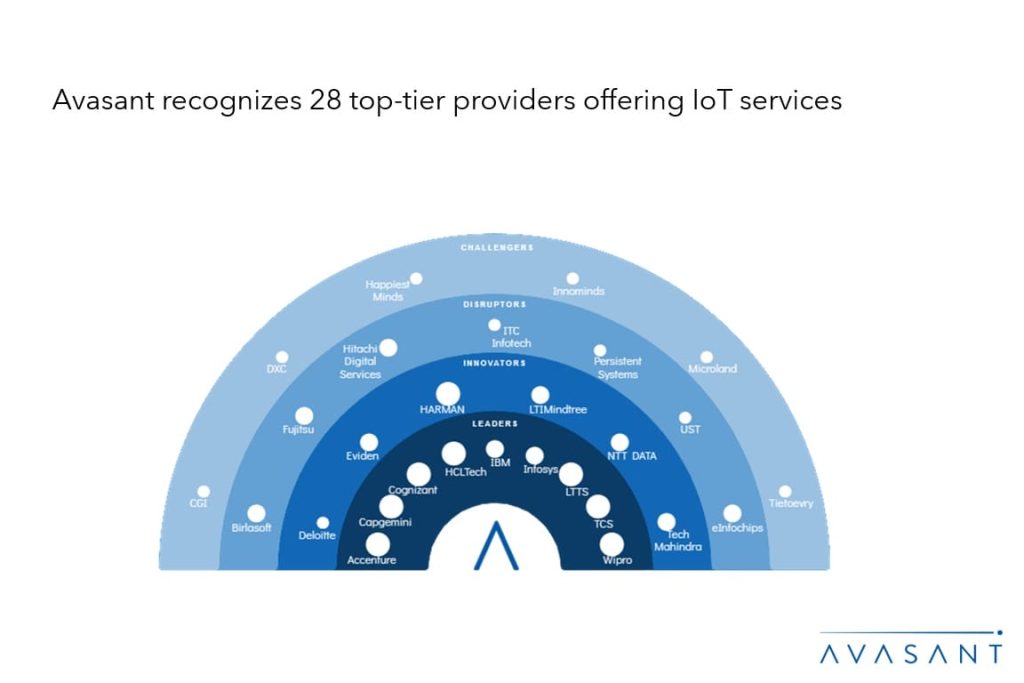
Digital Engineering Services 2025–2026 RadarView™
The Digital Engineering Services 2025–2026 RadarView™ can help enterprises identify the right partners and service providers to implement their digital engineering strategy by providing detailed capability and experience analysis for leading service providers. The report provides a 360-degree view of key providers for digital engineering services across practice maturity, partner ecosystem, and investments and innovations. The 70-page report also highlights top supply-side trends in the digital engineering space and Avasant’s viewpoint.

Advanced Networking — The Top Tech Trend for 2025
Digital workplace technologies, a relatively new category in our yearly study of technology trends, receives the best customer satisfaction score from our survey participants. Digital workplace technologies are a set of tools and electronic capabilities to allow workers to communicate and collaborate virtually from anywhere. The pandemic originally served as a springboard for the surge in this technology. But many companies, recognizing the value these tools provided during remote work, are now adopting or expanding their use to support ongoing remote or hybrid work models. This Research Byte provides a look at the customer satisfaction rating for digital workplace technologies, as well as an overview of our Technology Trends 2024.