
Areas of Interest
Content Type
Industries
- Aerospace and defense
- Banking, Financial Services, and Insurance
- Energy and Resources
- Federal Government
- Healthcare and life sciences
- High-tech and telecommunications
- Higher Education
- Media and entertainment
- Private equity
- Public Sector
- Retail and manufacturing
- Social Impact Institutions
- Travel and transportation
Technologies
- Artificial Intelligence
- Automation
- Blockchain
- Business and data analytics
- Cloud
- Customer relationship management (CRM)
- Cybersecurity
- Digital Services
- Enterprise resource planning (ERP)
- Human capital management (HCM)
- Internet Of Things
- Machine Learning
- Networking
- Supply chain management (SCM)
- Virtual reality/Augmented reality
Areas of Interest
Latest Reports
Risk and Compliance Services: Leveraging Automation Tools to Navigate Compliance Risks
Enterprises are focused on driving secure digital transformation, transitioning to proactive risk management. They are aiming to leverage AI/ML models to automate various aspects of compliance management, risk assessment, fraud detection, data privacy, and disaster recovery services. Service providers are developing solutions to not just mitigate security risks but also help organizations govern the use of technology safely across their IT infrastructure, given the pace and complexity of modern business operations. Both demand-side and supply-side trends are covered in our Risk and Compliance Services 2023 Market Insights™ and Risk and Compliance Services 2023 RadarView™, respectively.

Risk and Compliance Services 2023 Market Insights™
The Risk and Compliance Services 2023 Market Insights™ assists organizations in identifying important demand-side trends that are expected to have a long-term impact on any risk and compliance projects. The report also highlights key implementation challenges that enterprises face today.
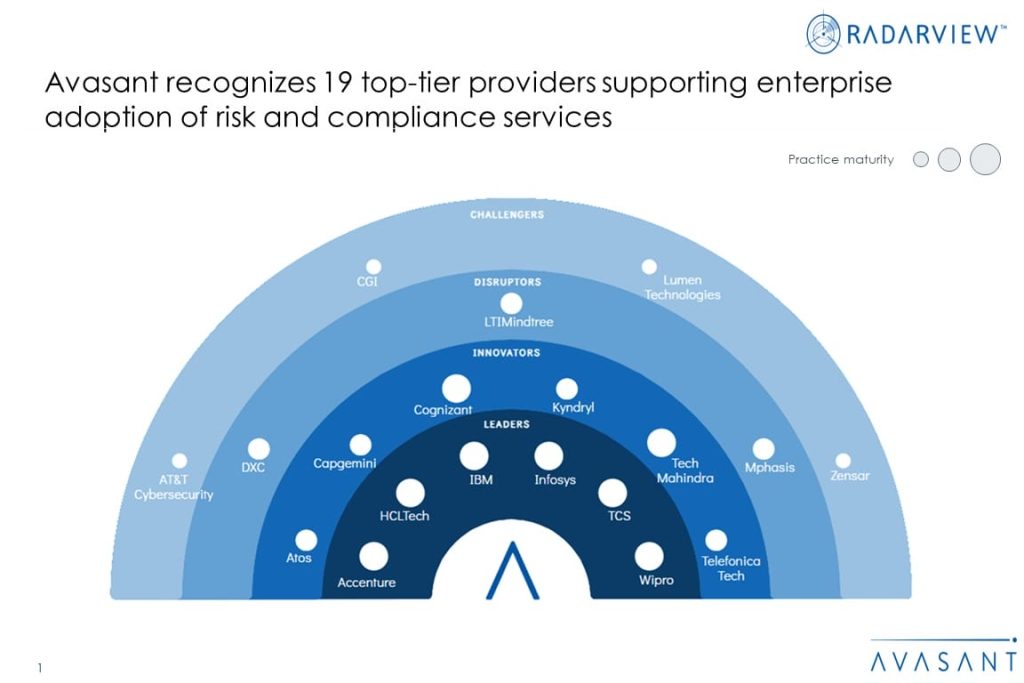
Risk and Compliance Services 2023 RadarView™
The Risk and Compliance Services 2023 RadarView™ assists organizations in identifying strategic partners for risk and compliance services by offering detailed capability and experience analyses for service providers. It provides a 360-degree view of key service providers across practice maturity, partner ecosystem, and investments and innovation, thereby supporting enterprises in identifying the right technology partner. The 59-page report highlights top supply-side trends in the risk and compliance space and Avasant’s viewpoint on them.
Current Fair Market Values October 2023
The Computer Economics Market Value Reports provide information on the most commonly traded machines and systems at the time the report is published. The values shown are the composites of a range of quotes acquired from sources within the industry deemed reliable, accuracy of the information presented is not guaranteed. Resources are eBay, Insight, NewEgg, CDW, ETB-Tech, Amazon, Savemyserver, TheServerStore, LoadBalancer, NetworkOutlet, Netsyst-Direct, TigerDirect, and others as well as online sales companies and appraisals.

DeFi Asset Tokenization – Tokenization Drives Efficiency to Influence the Role of Regulated Markets
The whitepaper explores how multiple forces, including macroeconomic factors and technological shifts, are shaping the future of financial services and how DeFi asset tokenization helps address the current challenges. It covers aspects such as disruptive forces shaping the future of financial services, the need for cost transformation, tokenization’s role in addressing the current challenges in regulated financial markets, tokenization’s benefits across the capital markets value chain, and the role of service providers. It offers insights into what can be defined as a potential digital asset class and the unique advantages offered through DeFi asset tokenization for those asset classes.

Generative AI: A Catalyst for Transforming the Manufacturing Industry
Generative AI is reshaping the future of AI and gaining momentum across various industries, including manufacturing. This whitepaper explores the use cases and enterprise applications of generative AI to utilize previously unexplored data sets and address industry challenges. It also highlights five key areas where generative AI is gaining traction within the manufacturing sector, such as accelerating product design, optimizing production processes, and so on. Finally, it discusses implementation challenges that hinder manufacturing enterprises from adopting generative AI at scale. By proactively investing in the right resources and addressing challenges, manufacturers can accelerate generative AI adoption while mitigating its potential risks.
Avasant Partner Connect 2023 – Kevin Parikh Key Note
At Avasant’s Partner Connect 2023, our global leadership team shared invaluable insights on the latest industry trends and next generation transformation solutions that are reshaping the future. The deals of today are requiring new levels of creativity and solutioning to drive value and build strategic relationships. In his opening keynote session, Chairman and CEO, Kevin Parikh prognosticates the future for strategic sourcing and the opportunities ahead for unlocking tech-enabled innovation for managed services. He discusses how traditional labor-based managed services are being disrupted and replaced by tech-enabled services, and the importance of investing in partnerships with disruptive technology companies to support a broader service delivery ecosystem.
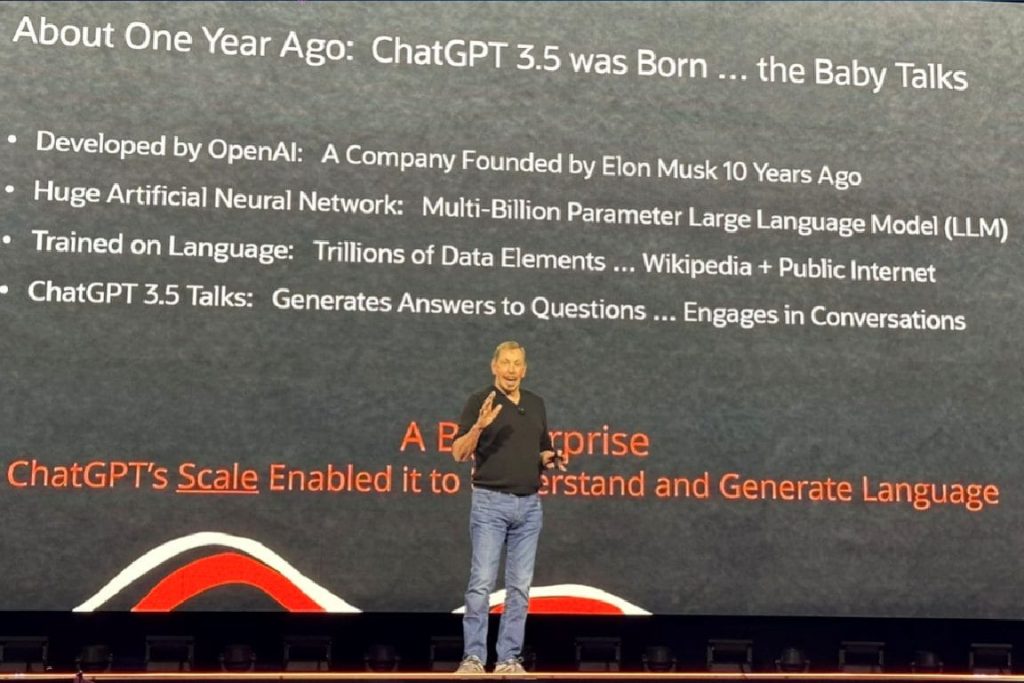
Oracle Racing to Catch Up with Focus on Generative AI
As Oracle’s CloudWorld conference returned to Las Vegas this month, the question on many lips was: Since Oracle appeared to be a bit late to the generative AI party, will its aggressive focus allow it to catch up? It appears to be something of a theme for Oracle, which was famously late to the cloud (see below). Though, to be fair, the software and database giant is responding much more quickly and very aggressively to this scorching hot trend.
Ethical Hotline Systems 2023 RadarView Scan™
Avasant’s Ethical Hotline Systems 2023 RadarView Scan™ helps enterprises in evaluating key vendors providing ethical hotline services. The 16-page report also highlights how vendors leverage their capabilities to provide ethical hotline services to address these challenges.
Current Fair Market Values September 2023
The Computer Economics Market Value Reports provide information on the most commonly traded machines and systems at the time the report is published. The values shown are the composites of a range of quotes acquired from sources within the industry deemed reliable, accuracy of the information presented is not guaranteed. Resources are eBay, Insight, NewEgg, CDW, ETB-Tech, Amazon, Savemyserver, TheServerStore, LoadBalancer, NetworkOutlet, Netsyst-Direct, TigerDirect, and others as well as online sales companies and appraisals.