
Areas of Interest
Content Type
Industries
- Aerospace and defense
- Banking, Financial Services, and Insurance
- Energy and Resources
- Federal Government
- Healthcare and life sciences
- High-tech and telecommunications
- Higher Education
- Media and entertainment
- Private equity
- Public Sector
- Retail and manufacturing
- Social Impact Institutions
- Travel and transportation
Technologies
- Artificial Intelligence
- Automation
- Blockchain
- Business and data analytics
- Cloud
- Customer relationship management (CRM)
- Cybersecurity
- Digital Services
- Enterprise resource planning (ERP)
- Human capital management (HCM)
- Internet Of Things
- Machine Learning
- Networking
- Supply chain management (SCM)
- Virtual reality/Augmented reality
Areas of Interest
Latest Reports

Why Customer Relationship Management (CRM) Contracts Must Be Rewritten for the AI Era
Enterprise CRM platforms are evolving fast. The risk landscape has shifted dramatically with embedded AI capabilities now driving everything from customer insights to automated communications. Legacy contracts, built for static systems, are no longer fit for purpose. The integration of AI into CRM systems transforms how data is collected, processed, and utilized, creating new challenges related to data privacy, security, intellectual property, and vendor accountability.

Life and Annuities Insurance Digital Services 2025 Market Insights™
The Life and Annuities Insurance Digital Services 2025 Market Insights™ assists organizations in identifying important demand-side trends that are expected to have a long-term impact on any digital project in the L&A insurance industry. The report also highlights key challenges that enterprises face today in this space.
Life and Annuities Insurance Digital Services: Empowering Advisors and Policyholders through Digital Platforms
The life and annuities (L&A) insurance industry is adapting to rising demand for life insurance and annuity products by accelerating digital transformation. Insurers are introducing tools to empower advisors, enhance engagement, and deliver personalized experiences. To meet evolving expectations, firms are embedding retirement planning and holistic financial wellness features into digital platforms. While digital maturity varies globally, insurers are modernizing systems, consolidating vendors, and leveraging AI-driven capabilities to strengthen underwriting and advisory processes. At the same time, L&A insurers are forging strategic partnerships with service providers to fast-track digital transformation, ensuring innovation and customer-centricity remain central to growth strategies.

Life and Annuities Insurance Digital Services 2025 RadarView™
The Life and Annuities Insurance Digital Services 2025 RadarView™ can help enterprises craft a robust strategy based on industry outlook, best practices, and digital transformation. The report can also aid them in identifying the right partners and service providers to accelerate their digital transformation. The 101-page report also highlights top supply-side trends in the L&A insurance digital services space and Avasant’s viewpoint.

Healthcare Provider Digital Services 2025 Market Insights™
The Healthcare Provider Digital Services 2025 Market Insights™ assists organizations in identifying important demand-side trends that are expected to have a long-term impact on any digital project in the healthcare provider space. The report also highlights key challenges that enterprises face today.
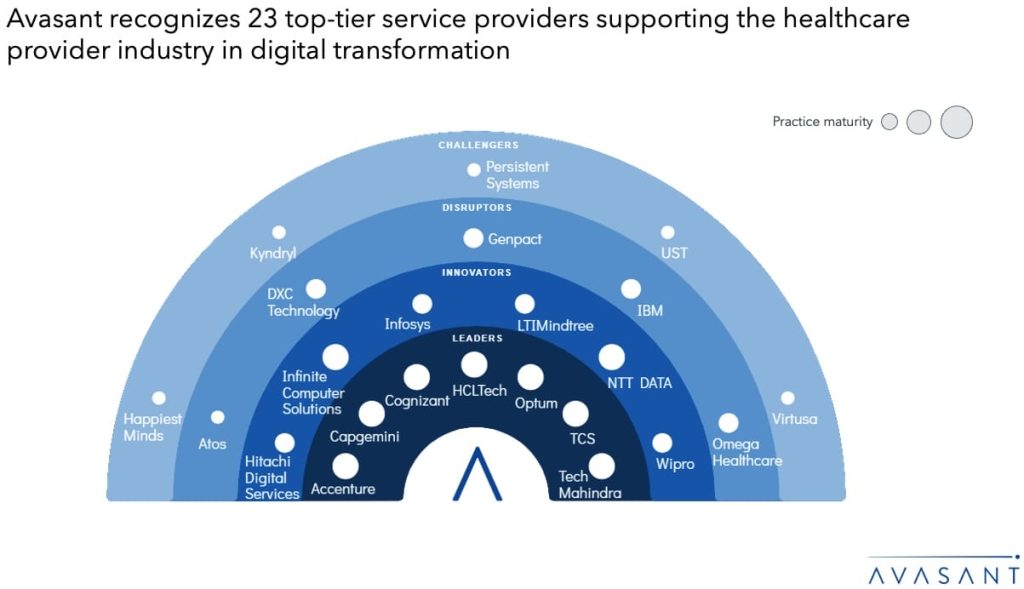
Driving Healthcare Provider Success through Digital Health Solutions
Healthcare providers face growing challenges, including workforce shortages, clinician burnout, and shrinking margins, which strain operational efficiency and patient care coordination. The need for seamless data exchange across systems and regulatory compliance compounds these pressures. To overcome these issues, providers are accelerating their digital transformation through the use of AI, predictive analytics, and intelligent automation to streamline workflows, manage denials, and enhance financial resilience. Adoption of Fast Healthcare Interoperability Resources (FHIR)-based APIs, remote monitoring, and telehealth expands access to care and enables proactive health management beyond traditional settings. At the same time, healthcare global competency centers (GCCs) are evolving into innovation hubs focused on AI, data interoperability, and digital maturity, driving sustainable growth and innovation. Providers are also strengthening their cybersecurity and consent management systems to protect patient data while ensuring control, compliance, and trust in an increasingly digital healthcare environment. Both demand-side and supply-side trends are covered in our Healthcare Provider Digital Services 2025 Market Insights™ and Healthcare Provider Digital Services 2025 RadarView™, respectively.

Navigating the Divestiture Process: From Strategy to Execution
In today’s volatile market, over 70% of Fortune 500 companies are actively reshaping their portfolios through divestitures. While the rewards are high, the risks are real. At Avasant, we help organizations turn complexity into clarity—transforming divestiture into a strategic growth engine.
Business Process Services Pricing and Solution Trends: H1 2025
In this report, Avasant provides key information on pricing and solution trends for the business process services industry from the past 12 months. The report covers various aspects, including market demand, provider solution trends, commercial engagement trends, emerging location trends, and pricing and staffing trends in the space. The geographic coverage is global, with a large share of data points from North America. The report builds on insights gathered through our enterprise interactions, ongoing market research, data collection, and the AvaMark™ Price Benchmarking database.
Healthcare Provider Digital Services 2025 RadarView™
The Healthcare Provider Digital Services 2025 RadarView™ can help healthcare providers craft a robust strategy based on industry outlook, best practices, and digital transformation. The report can also aid them in identifying the right partners and service providers to accelerate their digital transformation in this space. The 91-page report also highlights top market trends in the healthcare provider space and Avasant’s viewpoint.

Blockchain Services 2025 Market Insights™
The Blockchain Services 2025 Market Insights assists organizations in identifying key demand-side trends, application areas, and use cases for blockchain adoption. It also provides Avasant’s perspective on technology and blockchain trends that will impact digital transformation projects.