-

IT Spending and Staffing Benchmarks 2025/2026: Chapter 3C: Benchmarks by Organization Size: Large
In these chapters, we provide a complete set of benchmarks for organizations within the specified size classification. Small organizations benchmarks are in Chapter 3A, midsize organizations in Chapter 3B, large organizations in Chapter 3C, and very large organizations in Chapter 3D. There are 66 respondents in the small organization sample, 73 in the midsize sample, 86 in the large sample, and 84 in the very large sample.
August, 2025
-

IT Spending and Staffing Benchmarks 2025/2026: Chapter 15: Construction and Trade Services
Chapter 15 provides benchmarks for construction and trade services companies. The 38 respondents in the sample range in size from about $50 million to over $75 billion in annual revenue. The category includes engineering and construction companies, commercial, residential, and industrial construction contractors, specialty contractors, oil field services firms, firms that provide mining services, environmental services firms, and other construction and trade services firms.
August, 2025
-

IT Spending and Staffing Benchmarks 2025/2026: Chapter 38: Utilities Subsector Benchmarks
Chapter 38 provides benchmarks for utilities. The 23 respondents in this subsector range in size from $80 million to over $60 billion in annual revenue. This category includes gas and electric utilities, power transmission distributors, water and power utilities, and telecommunications service providers.
August, 2025
-

Residual Value Forecast October 2025
Our quarterly Residual Value Forecast (RVF) report provides forecasts for the following categories of IT equipment: desktop computers, laptops, network equipment, printers, servers, storage devices, and other IT equipment. It also includes residual values for other non-IT equipment in the following categories: copiers, material handling equipment (forklifts), mail equipment, medical equipment, test equipment, and miscellaneous equipment such as manufacturing machinery and NC machines. Residual Value Forecasts are provided for five years for end-user, wholesale, and orderly liquidation values (OLV) prices.
October, 2025
-
Worldwide Technology Trends 2023
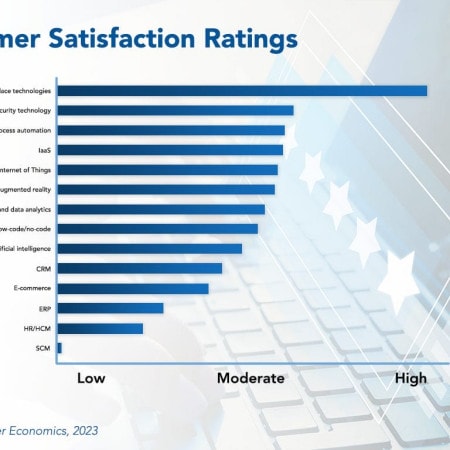
This major study provides insight into the customer experience and adoption rates for 14 technologies that are top-of-mind for IT leaders worldwide. The study also delves into the satisfaction level of the customer experience and the specific types of solutions under consideration. With this information business leaders are in a better position to assess the potential risks and rewards of each of these technologies. They also can gain insight into just how aggressively competitors and peers are making these investments. Looking forward, we also explore 17 future and early adopter technologies.
May, 2023
-
IT Spending and Staffing Benchmarks 2023/2024: Chapter 32: Hospitals Subsector Benchmarks
Chapter 32 provides benchmarks for hospitals. The 34 respondents in this subsector range in size from $50 million to around $8 billion in annual revenue. This category includes community hospitals, university hospitals, nonprofit hospitals, health clinics, healthcare systems, and regional healthcare providers.
July, 2023
-
IT Spending and Staffing Benchmarks 2023/2024: Chapter 23: Food and Beverage Subsector Benchmarks
Chapter 23 provides benchmarks for food and beverage manufacturers. The 31 respondents in the sample range in size from about $65 million to $40 billion in annual revenue. Food and beverage companies produce beverages, snack foods, meat products, seafood products, dairy products, dietary supplements, and other consumable food products. Some are suppliers to other food manufacturers or to the food service industry, while many also distribute consumer products to retailers or direct to consumers. This subsector does not include retailers of food and beverages, such as restaurants, unless they also manufacture their own food and beverage products.
July, 2023
-

IT Security Outsourcing Trends and Customer Experience 2023
IT security is a major focus for IT leaders that continues to grow in importance. The threat landscape is evolving with increased reliance on the cloud, greater diversity in the IT service portfolio, more employees working from home, and a more burdensome regulatory environment.
November, 2023
-
Disaster Recovery Plan Testing Best Practices 2024
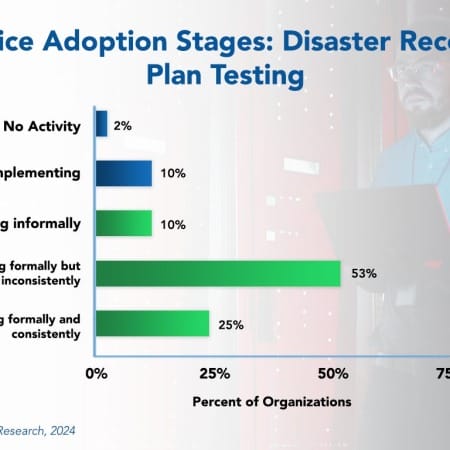
In today’s unpredictable business environment, there is an increasing reliance on data and digital systems to operate efficiently. With this comes the need for robust disaster recovery (DR) plans and testing to reduce the impact of unforeseen events. The effectiveness of a DR plan can only be truly validated through routine testing. However, while this practice is growing, few organizations are testing their DR plans formally and consistently. This Research Byte summarizes our full report on disaster recovery plan testing as a best practice.
January, 2024
-
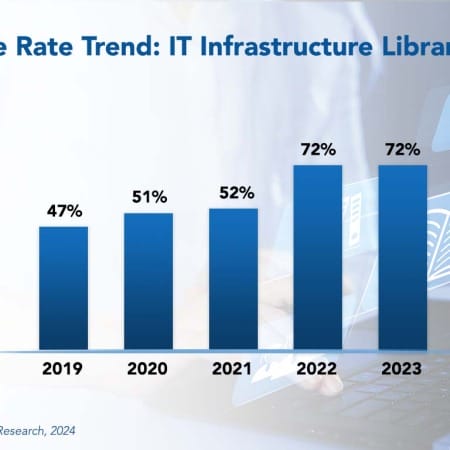
ITIL Best Practices 2024
The Information Technology Infrastructure Library (ITIL) is a framework of best practices and processes designed to assist businesses in supporting, delivering, and improving their IT services. The primary goal of ITIL is to ensure that IT services align with business objectives and customer needs. Frequently adopted ITIL processes include incident management, change management, and problem management.
March, 2024
-

IT Spending Trends in the Energy and Utilities Sector 2024
It is a challenging time for organizations in the energy and utilities sector, with global conflicts, supply chain issues, government mandates, and environmental concerns churning the waters. The demands on their IT organizations are significant. What is it about the energy and utilities sector that makes it unique? In this report, we analyze the ways in which this sector differs from other sectors in terms of their IT spending characteristics. We conclude with recommendations for optimizing the IT budget within this sector.
May, 2024
-

Residual Value Forecast June 2024
Our quarterly Residual Value Forecast (RVF) report provides forecasts for the following categories of IT equipment: desktop computers, laptops, network equipment, printers, servers, storage devices, and other IT equipment. It also includes residual values for other non-IT equipment in the following categories: copiers, material handling equipment (forklifts), mail equipment, medical equipment, test equipment, and miscellaneous equipment such as manufacturing machinery and NC machines. Residual Value Forecasts are provided for five years for end-user, wholesale, and orderly liquidation values (OLV) prices.
June, 2024
-

IT Spending and Staffing Benchmarks 2024/2025: Chapter 3D: Benchmarks by Organization Size: Very Large
This year, Avasant Research is celebrating the 35th anniversary of the Computer Economics IT Spending and Staffing Benchmarks study. To mark this milestone, we have accumulated the largest sample of companies in our history (over 350 companies in our single-year sample compared to 215 last year), including a significant number of the world’s largest enterprises. For the first time, we not only have small, midsize, and large chapters but also a very large chapter for companies with over $500 million in IT spending.
September, 2024
-

IT Spending and Staffing Benchmarks 2024/2025: Chapter 38: Technical Services
Chapter 38 provides benchmarks for technical services organizations. The 29 respondents in the sample range in size from a minimum of about $50 million to about $50 billion in annual revenue. This subsector includes firms that provide technical services, such as engineering, architectural, scientific, research, and other services.
September, 2024
-

IT Spending and Staffing Benchmarks 2024/2025: Chapter 26: Industrial and Automotive
Chapter 26 provides benchmarks for industrial and automotive manufacturers. The 45 respondents in this subsector make auto parts, material handling equipment, engines, machinery, vehicles, and similar durable goods. The manufacturers in the sample range in size from about $50 million to over $200 billion in annual revenue.
September, 2024

 Grid View
 List View