-

European IT Spending and Staffing Benchmarks 2025/2026: Chapter 23: Paper and Packaging
Chapter 23 focuses on benchmarks for the paper and packaging subsector, encompassing various organization sizes. As a critical component of the broader process manufacturing sector, respondents in this subsector typically include pulp and paper mills, containerboard and corrugated packaging manufacturers, flexible packaging producers, specialty paper converters, and other companies involved in the production and distribution of paper-based and allied packaging materials. The 16 companies in our sample range in annual revenue from approximately €60 million to well over €15 billion, reflecting the diverse scale of operations within the industry.
September, 2025
-

European IT Spending and Staffing Benchmarks 2023/2024: Chapter 6: Banking and Finance Sector Benchmarks
Chapter 6 provides benchmarks for banking and financial services companies. The firms in this sector include commercial banks, investment banks, mortgage lenders, consumer finance lenders, and other types of lenders and financial services providers. The 17 respondents in this sector range in size from a minimum of about €100 million to over €30 billion in annual sales.
September, 2023
-

European IT Spending and Staffing Benchmarks 2023/2024: Chapter 22: Online Retail Subsector Benchmarks
Chapter 22 provides benchmarks for online retailers. This subsector includes clothing retailers, home furnishing retailers, dietary supplements and health products retailers, agricultural retailers, pharmaceutical retailers, educational products retailers, sports equipment retailers, and other online retailers. The 15 respondents in this sample have annual revenue ranging from about €100 million to about €20 billion.
September, 2023
-

European IT Spending and Staffing Benchmarks 2024/2025: Chapter 12: Professional and Technical Services Sector Benchmarks
Chapter 12 provides benchmarks for professional and technical services organizations. The 44 respondents in the sample range in size from a minimum of about €50 million to about €45 billion in annual revenue. The sector includes firms that provide professional and technical services, including engineering, legal, accounting, financial advice, consulting, marketing, research, and other services.
October, 2024
-

European IT Spending and Staffing Benchmarks 2024/2025: Chapter 28: Technical Services Subsector Benchmarks
Chapter 28 provides benchmarks for technical services organizations. The 17 respondents in the sample range in size from a minimum of about €50 million to about €70 billion in annual revenue. This subsector includes firms that provide technical services, such as engineering, architectural, scientific, research, and other services.
October, 2024
-

European IT Spending and Staffing Benchmarks 2025/2026: Chapter 6: Banking and Finance
Chapter 6 provides benchmarks for banking and financial services companies. The firms in this sector include commercial banks, investment banks, credit unions, mortgage lenders, consumer finance lenders, and other types of lenders and financial services providers. The 25 respondents in this sector range in size from a minimum of about €75 million to around €40 billion in annual sales.
September, 2025
-

European IT Spending and Staffing Benchmarks 2025/2026: Chapter 24: Aerospace and Defense
Chapter 24 provides benchmarks for aerospace and defense companies. This category includes airplane and aerospace manufacturers, makers of weapons systems, aerospace and defense research, and other defense companies. The 15 respondents in this sample range in size from a minimum of about €85 million to over €60 billion in revenue.
September, 2025
-
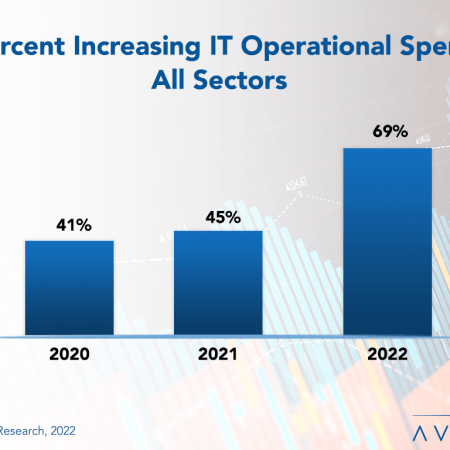
Tough Times in Europe Call for IT Budget Growth
In recent years, Europe has been hit by a pandemic, double-digit inflation, and a war. The subsequent supply chain disruptions, shortages of food and fuel, and looming recession do not make anything any easier for IT organizations on the continent. Still, IT budgets are rising. Not necessarily at the pace of rampant inflation. But still more than typical in times of economic contraction. It is starting to become clear that most enterprises now view IT as a strategic resource in weathering uncertainty. IT is no longer seen as a cost center but as a strategic resource that can impact the top and bottom lines. This research byte is a brief description of some of the findings in our European IT Spending and Staffing Benchmarks 2022/2023 study.
September, 2022
-

European IT Spending and Staffing Benchmarks 2022/2023: Chapter 17: Industrial and Automotive Subsector Benchmarks
Chapter 17 provides benchmarks for industrial and automotive manufacturers. The 20 respondents in this subsector make auto parts, material handling equipment, engines, machinery, vehicles, and similar capital goods. The manufacturers in the sample range in size from €120 million to over €250 billion in annual revenue.
September, 2022
-

European IT Spending and Staffing Benchmarks 2022/2023: Chapter 16: Food and Beverage Subsector Benchmarks
Chapter 16 provides benchmarks for food and beverage manufacturers. The 19 respondents in the sample range in size from €100 million to over €25 billion in annual revenue. Food and beverage companies produce beverages, meat products, seafood products, dairy products, dietary supplements, bakery ingredients, and other consumable food products. Some are suppliers to other food manufacturers or to the food service industry, while many also distribute consumer products to retailers or direct to consumers.
September, 2022
-

European IT Spending and Staffing Benchmarks 2022/2023: Chapter 15: IT Services and Solutions Sector Benchmarks
Chapter 15 provides IT spending and staffing statistics for the IT services and solutions sector. The category includes software companies, software-as-a-service providers, systems integrators, IT solution providers, business process outsourcing firms, and other providers of technology services and solutions. There are 23 organizations in the sample, ranging in size from around €13 million to over €25 billion in annual revenue.
September, 2022
-

European IT Spending and Staffing Benchmarks 2022/2023: Chapter 14: Construction and Trade Services Sector Benchmarks
Chapter 14 provides benchmarks for construction and trade services companies. The 13 respondents in the sample range in size from about €60 million to over €20 billion in annual revenue. The category includes engineering and construction companies, commercial, residential, and industrial construction contractors, ship builders, specialty contractors, environmental services firms, and other construction and trade services firms.
September, 2022
-

European IT Spending and Staffing Benchmarks 2022/2023: Chapter 13: Transportation and Logistics Sector Benchmarks
Chapter 13 provides benchmarks for the transportation and logistics sector. The 10 respondents in this sample range in size from a minimum of about €120 million to over €5 billion. The category includes organizations that operate buses, trucks, railways, airlines, barges, and ships. The sector also includes logistics companies that transport goods and transportation companies as well as regional and national transportation authorities that move people.
September, 2022
-

European IT Spending and Staffing Benchmarks 2022/2023: Chapter 12: Professional and Technical Services Sector Benchmarks
Chapter 12 provides benchmarks for professional and technical services organizations. The 38 respondents in the sample range in size from a minimum of about €50 million to about €80 billion in annual revenue. The sector includes firms that provide professional and technical services, including engineering, legal, accounting, financial advice, consulting, marketing, research, and other services.
September, 2022
-
European IT Spending and Staffing Benchmarks 2022/2023: Chapter 11: Healthcare Services Sector Benchmarks
Chapter 11 provides benchmarks for healthcare services companies. The 12 respondents in this sector include community hospital groups, national and regional hospital systems, healthcare systems, long-term care facilities, and other healthcare organizations. These organizations range in size from a minimum of about €178 million to over €15 billion in annual revenue.
September, 2022

 Grid View
 List View