
Areas of Interest
Content Type
Industries
- Aerospace and defense
- Banking, Financial Services, and Insurance
- Energy and Resources
- Federal Government
- Healthcare and life sciences
- High-tech and telecommunications
- Higher Education
- Media and entertainment
- Private equity
- Public Sector
- Retail and manufacturing
- Social Impact Institutions
- Travel and transportation
Technologies
- Artificial Intelligence
- Automation
- Blockchain
- Business and data analytics
- Cloud
- Customer relationship management (CRM)
- Cybersecurity
- Digital Services
- Enterprise resource planning (ERP)
- Human capital management (HCM)
- Internet Of Things
- Machine Learning
- Networking
- Supply chain management (SCM)
- Virtual reality/Augmented reality
Areas of Interest
Latest Reports

European IT Spending and Staffing Benchmarks 2023/2024: Chapter 3C: Large Organization Benchmarks
In these chapters, we provide a complete set of benchmarks for organizations within the specified size classification. IT operational budgets €25 million or greater.
European IT Spending and Staffing Benchmarks 2023/2024: Chapter 3B: Midsize Organization Benchmarks
In these chapters, we provide a complete set of benchmarks for organizations within the specified size classification. IT operational budgets between €5 million and less than €25 million.

European IT Spending and Staffing Benchmarks 2023/2024: Chapter 3A: Small Organization Benchmarks
Chapter 3A provides benchmarks for small organizations, across all sectors in Europe. Small organizations are defined as organizations having IT operational budgets of of of less than €5 million

European IT Spending and Staffing Benchmarks 2023/2024: Chapter 1: Executive Summary
This chapter provides an overview of the key findings from the European study and describes the contents of the subsequent chapters. It also includes information on the study participants and the survey methodology.
European IT Spending and Staffing Benchmarks 2023/2024: Chapter 2: Composite Benchmarks
This chapter provides composite metrics for all survey respondents across all sectors and organization sizes. The sample includes 101 organizations and is stratified by size and sector as described in the section on survey methodology. Respondents must have at least €50 million in annual revenue or IT spending in excess of €1 million and maintain at least some operations in Europe. There is no upper limit on the size of survey respondents.

Generative AI – Opportunities and Challenges
Although artificial intelligence originated in academic research in the 1950s, only recently has it captured the imagination of the general public. This has everything to do with the release of ChatGPT, putting a powerful tool in the hands of individual consumers. But what are the opportunities it brings to businesses? And what are the challenges we face in using it? To answer these questions, Avasant Senior Partner Frank Scavo recently conducted a video interview on this subject. This Research Byte provides a link to the full interview.
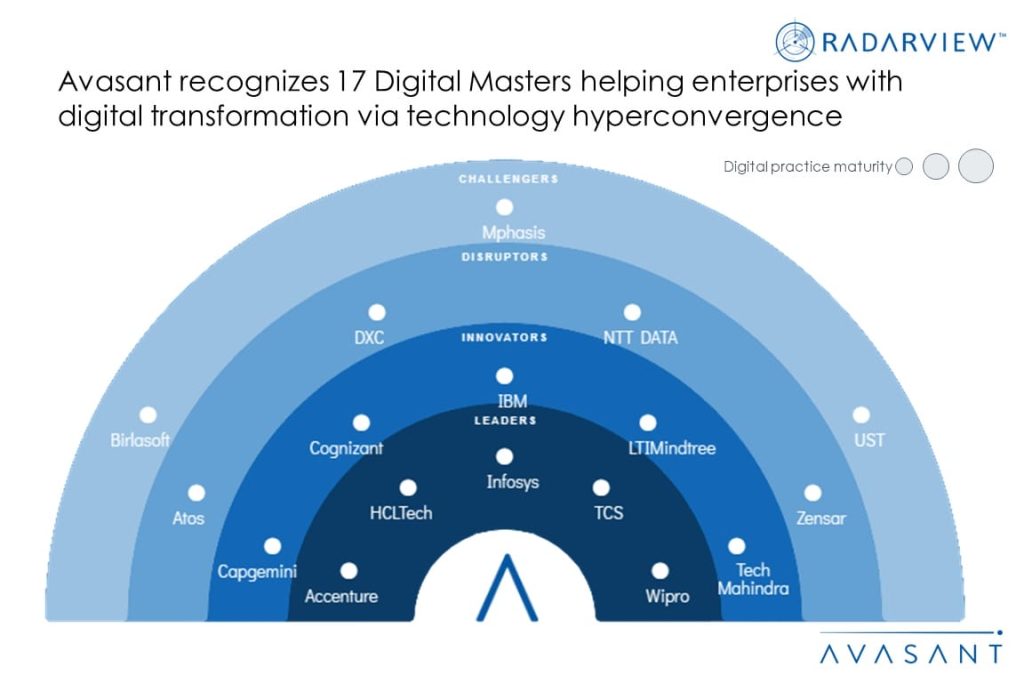
Digital Masters: Balancing Cost Optimization with Innovation through Hyperconvergence
The global economy is showing signs of resilience. However, although the overall economic outlook appears positive in the near future, it remains challenging in the medium term. As a result, enterprises are enhancing their focus on cost rationalization and turning to a zero-cost transformation strategy to drive and safeguard their digital transformation initiatives. In this transformation, cybersecurity also plays a crucial role as organizations prioritize post-pandemic network security. With the need to balance cost optimization with the innovation and growth narrative, enterprises realize the value of hyperconvergence of digital technologies, wherein service providers help them overcome implementational, technological, and talent-related challenges. Both demand-side and supply-side trends are covered in our Digital Masters 2023 Market Insights™, and our Digital Masters 2023 RadarView™ provides crucial business forecasts for each of the Digital Masters.

Digital Masters 2023 Market Insights™
The Digital Masters 2023 Market Insights™ assists organizations in identifying important trends related to enterprise digital technology adoption and the role of hyperconvergence. It also highlights the current landscape of generative AI, the key players, recent developments, and trends.
Digital Masters 2023 RadarView™
The Digital Masters 2023 RadarView™ assists organizations in identifying strategic partners for their digital transformation initiatives by offering detailed profiles for each service provider. It provides a 360-degree view of the provider’s capabilities and market standings in individual technology prerequisites, hyperconvergence of technologies, and readiness for the future, along with a list of representative clients and brief client case studies. The 60-page report also provides our business forecasts for each Digital Master and Avasant’s viewpoint on them.
IT and Apps Managed Services Provider Trends: Quarterly Report for CQ2 2023
In this quarterly report (calendar quarter 2, 2023), Avasant provides key information on IT and apps managed services provider trends. The report covers key information on the IT services industry and the provider ecosystem. It covers the service provider facts and figures (including revenue and resource trends), macro trends, and executive sentiment from the service provider community. The report covers trends across a gamut of IT services, including but not limited to IT infrastructure, application, and end-user services. The geographic coverage for the report is global. It builds on insights gathered through ongoing market research, data collection, and proprietary databases. It includes market data from providers accessed through multiple sources such as public disclosures, market interactions, and deals data.