
Areas of Interest
Content Type
Industries
- Aerospace and defense
- Banking, Financial Services, and Insurance
- Energy and Resources
- Federal Government
- Healthcare and life sciences
- High-tech and telecommunications
- Higher Education
- Media and entertainment
- Private equity
- Public Sector
- Retail and manufacturing
- Social Impact Institutions
- Travel and transportation
Technologies
- Artificial Intelligence
- Automation
- Blockchain
- Business and data analytics
- Cloud
- Customer relationship management (CRM)
- Cybersecurity
- Digital Services
- Enterprise resource planning (ERP)
- Human capital management (HCM)
- Internet Of Things
- Machine Learning
- Networking
- Supply chain management (SCM)
- Virtual reality/Augmented reality
Areas of Interest
Latest Reports
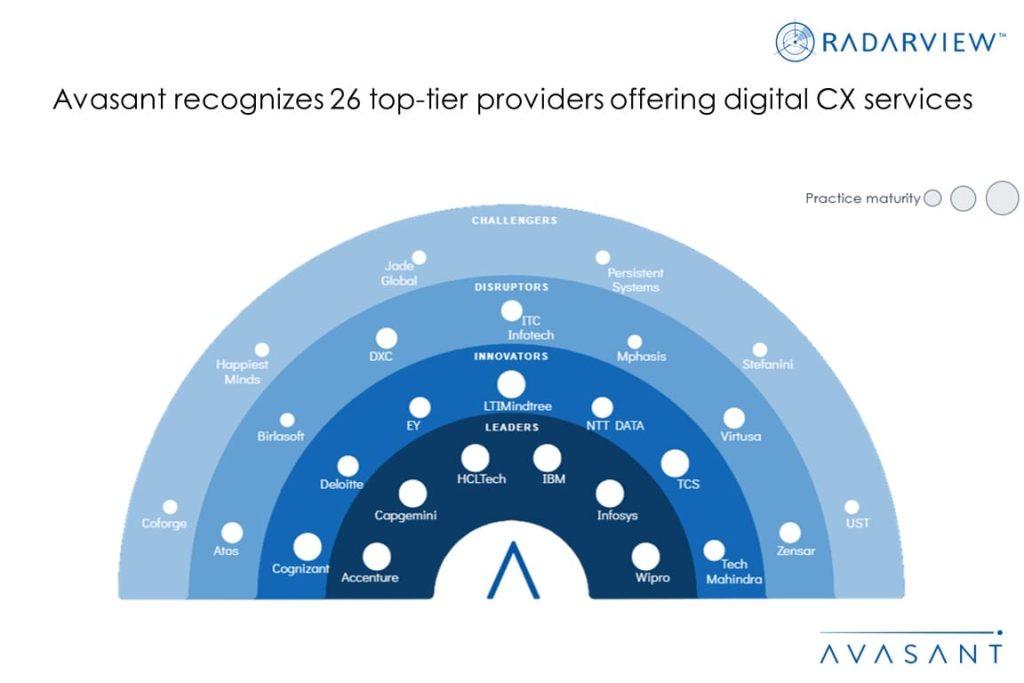
Digital CX Services: Empowering Growth Through a Connected and Engaging Customer Experience
Enterprises are revamping their CX strategies by eliminating data silos between multiple customer touchpoints and different business functions to create a single view of customers and deliver unified CX. Companies across sectors are pivoting toward a business outcome-driven approach to CX transformation that measures and drives key business outcomes such as increasing customer conversion, sales, customer engagement, and cost and inventory optimization. The focus has shifted toward leading with an integrated CX. As a result, the providers focus on a broader spectrum of digital CX services. These trends, among others, are covered in Avasant’s Digital CX Services 2023 RadarView™ and Digital CX Services 2023 Market Insights™.

Digital CX Services 2023 Market Insights™
The Digital CX Services 2023 Market Insights™ assists organizations in identifying important demand-side trends that are expected to have a long-term impact on any digital CX services project. The report also highlights key challenges that enterprises face today.
Digital CX Services 2023 RadarView™
The Digital CX Services 2023 RadarView™ assists organizations in identifying strategic partners for CX transformation by featuring detailed capabilities and analyses of leading service providers. It provides a 360-degree view of key digital CX services providers across practice maturity, partner ecosystem, and investments and innovation. The 75-page report highlights top supply-side trends in the digital CX services space and Avasant’s viewpoint on them.
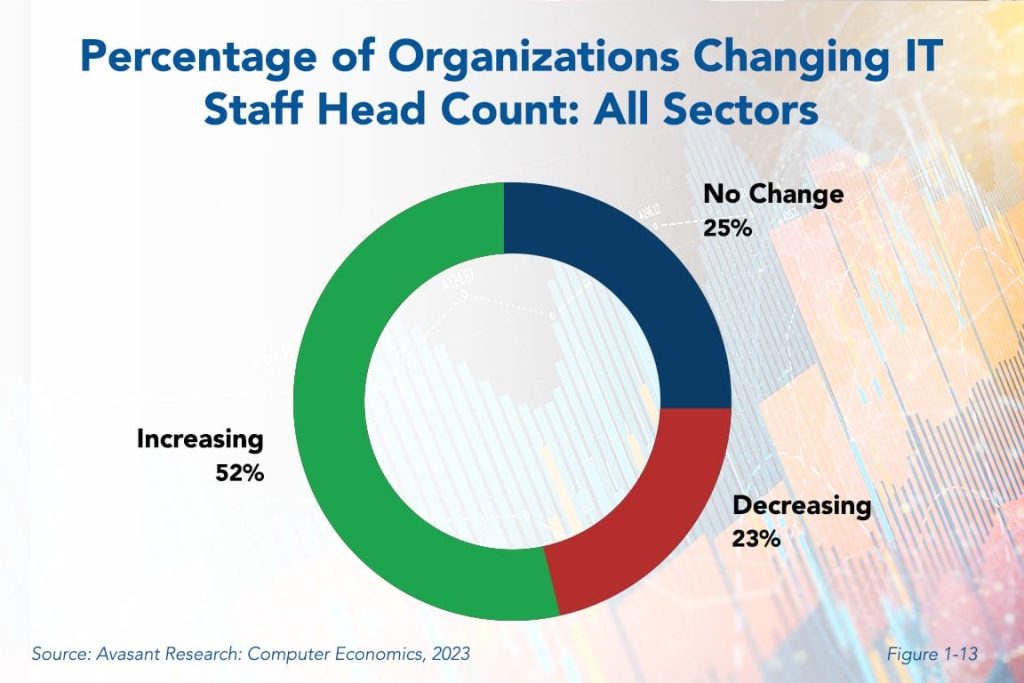
IT Staff Growth Mixed Bag
There have been quite a few competing pressures on IT hiring in recent years. Organizations need more talent, especially those that understand the needs of business and the art of the possible. On the other hand, labor has gotten more expensive and harder to find. Combine the push and pull from these competing factors with economic uncertainty, and this is one of the stranger hiring years in recent memory. This research byte is a brief description of some of the findings in our IT Spending and Staffing Benchmarks 2023/2024 study.
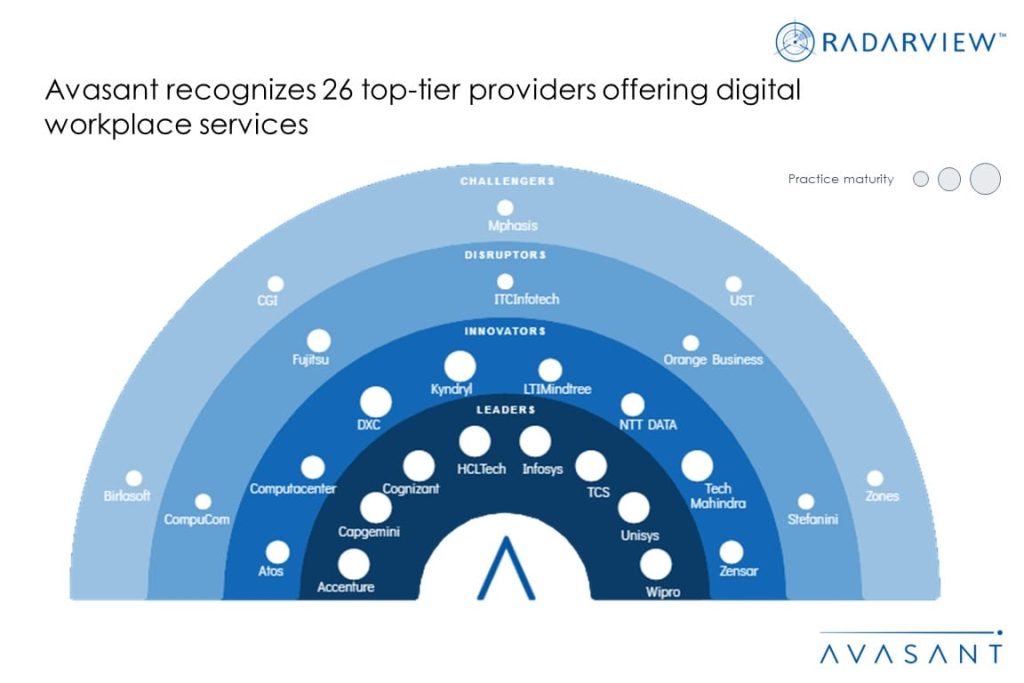
Digital Workplace Services: Driving Organization Agility and Innovation in the Era of Hybrid Work
The hybrid workplace has made significant strides since its inception in 2020, with the 2–3-day work-from-home model being widely accepted. Enterprises are dedicated to enhancing employee experience through outcome-based engagements with service providers and experience-level agreements (XLAs) by leveraging emerging technologies such as AI/ML, analytics, IoT, and automation; creating new possibilities in the workplace; and fostering increased collaboration, productivity, and employee satisfaction. These trends, among others, are covered in Avasant’s Digital Workplace Services 2023 RadarView™ and Digital Workplace Services 2023 Market Insights™.

Digital Workplace Services 2023 Market Insights™
The Digital Workplace Services 2023 Market Insights™ assists organizations in identifying important demand-side trends that are expected to have a long-term impact on any digital workplace services project. The report also highlights key challenges that enterprises face today.
Digital Workplace Services 2023 RadarView™
The Digital Workplace Services 2023 RadarView™ assists organizations in identifying strategic partners for workplace transformation by featuring detailed capabilities and analyses of leading service providers. It provides a 360-degree view of key digital workplace services providers across practice maturity, partner ecosystem, and investments and innovation. The 73-page report highlights top supply-side trends in the digital workplace services space and Avasant’s viewpoint on them.
Moving from Cost Optimization to Value Generation Through Procurement Transformation
Traditionally, procurement was considered a cost center but, of late, procurement has become a strategic business function within enterprises. As a result, the role of a Chief Procurement Officer (CPO) is evolving from reducing costs to maintaining supply chain resilience in addition to deriving higher value from their sourcing and procurement function. The priority is not new; however, varied supply chain disruptions are bringing it to the forefront. Further, organizations are engaging domain experts and investing in AI, automation, and analytics to generate higher value from the procurement function. They are increasingly leveraging service provider support to parallelly transform people, processes, and technology. As a result, procurement business process transformation deals have grown by over 15% between March 2022 and March 2023. Both demand- and supply-side trends are covered in Avasant’s Procurement Business Process Transformation 2023 Market Insights™ and Procurement Business Process Transformation 2023 RadarView™, respectively.
Procurement Business Process Transformation 2023 Market Insights™
The Procurement Business Process Transformation 2023 Market Insights™ assists organizations in identifying important demand-side trends that are expected to have a long-term impact on any procurement transformation project. The report also highlights the evolution of the procurement function and emerging CPO priorities.
Procurement Business Process Transformation 2023 RadarView™
The Procurement Business Process Transformation 2023 RadarView™ assists organizations in identifying strategic partners for procurement business process transformation by offering detailed capability and experience analyses for service providers. It provides a 360-degree view of key procurement business process transformation service providers across practice maturity, domain ecosystem, and investments and innovation, thereby supporting enterprises in identifying the right services partner. The 52-page report highlights top supply-side trends in the procurement space and Avasant’s viewpoint on them.