
Areas of Interest
Content Type
Industries
- Aerospace and defense
- Banking, Financial Services, and Insurance
- Energy and Resources
- Federal Government
- Healthcare and life sciences
- High-tech and telecommunications
- Higher Education
- Media and entertainment
- Private equity
- Public Sector
- Retail and manufacturing
- Social Impact Institutions
- Travel and transportation
Technologies
- Artificial Intelligence
- Automation
- Blockchain
- Business and data analytics
- Cloud
- Customer relationship management (CRM)
- Cybersecurity
- Digital Services
- Enterprise resource planning (ERP)
- Human capital management (HCM)
- Internet Of Things
- Machine Learning
- Networking
- Supply chain management (SCM)
- Virtual reality/Augmented reality
Areas of Interest
Latest Reports

Contract Harmonization in Mergers and Acquisitions: Strategies for Seamless IT Integration
As enterprises pursue mergers and acquisitions (M&A) to expand market share and accelerate innovation, one critical success factor often remains under the radar: IT contract harmonization. Misaligned agreements can quietly erode deal value leading to duplicated services, compliance risks, and operational disruptions. In fact, up to 10% of projected synergies are lost due to poor contract alignment.

Microsoft’s Elimination of Volume-Based Price Levels: A New Era in Enterprise Licensing Economics
Microsoft’s elimination of volume-based pricing tiers across its EA, MPSA, and OSPA programs marks a major shift in enterprise software economics. Effective November 1, 2025, all online services will default to Level A list pricing that will end scale-based discounts for large customers. This paper examines the implications of Microsoft’s policy change, the resulting budget and negotiation challenges for enterprises, and how Avasant assists clients in responding through immediate optimization, strategic contracting, and sustainable governance—transforming cost pressure into commercial control.
AI-First Digital Workplaces: Driving Productivity, Compliance, and Employee Experience
The digital workplace is becoming an AI-driven, experience-centric environment where digital employee experience (DEX) is a key metric linking technology to productivity and retention. Enterprises are using platforms such as Nexthink and Lakeside SysTrack for visibility, persona-based support, and proactive IT operations. AI-first collaboration and automation are streamlining workflows, reducing costs, and personalizing employee experiences. Meanwhile, AI-powered endpoint management and integrated IAM/PAM controls enhance compliance and accelerate remediation. Service providers are building digital command centers and autonomous workplace platforms powered by generative and agentic AI. Together, these advances are shaping the next generation of adaptive, intelligent digital workplaces.

Digital Workplace Services 2025 Market Insights™
The Digital Workplace Services 2025 Market Insights™ assists organizations in identifying key demand-side trends that are expected to have a long-term impact on digital workplace projects. The report also highlights key workplace modernization challenges that enterprises face today.
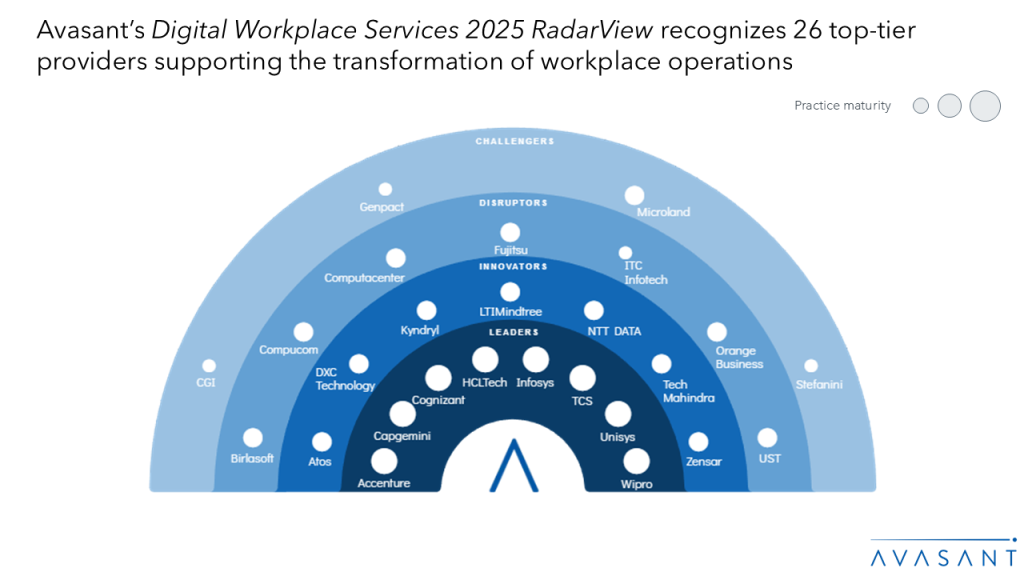
Digital Workplace Services 2025 RadarView™
The Digital Workplace Services 2025 Market Insights™ assists organizations in identifying strategic partners for workplace modernization by offering detailed capabilities for service providers. It provides a 360-degree view of key digital workplace service providers across practice maturity, partner ecosystem, and investments and innovation, thereby supporting enterprises in identifying the right service partner. The 76-page report highlights top supply-side trends in the digital workplace services space and Avasant’s viewpoint on them.

AI-Enabled CRM: Redefining ESG and Strategic Sourcing Resilience in Procurement
As procurement leaders face rising Environmental, Social, and Governance (ESG) mandates and supply chain volatility, over 60% of enterprises now prioritize AI in sourcing strategies. CRM platforms like HubSpot’s Breeze ecosystem are evolving into strategic sourcing engines, delivering real-time intelligence, automated compliance workflows, and embedded ESG oversight. These capabilities illustrate how AI-enabled CRMs are being applied to procurement, equipping teams with enhanced supplier visibility and data-driven decision-making. While HubSpot’s Breeze ecosystem exemplifies this evolution, other CRM platforms including Salesforce, Microsoft Dynamics 365, and Zoho CRM, are also expanding into procurement intelligence, offering similar AI-driven capabilities that support supplier visibility and strategic decision-making.

Ambient AI Scribes: Streamlining Clinical Documentation for Operational Efficiency
The integration of advanced technologies such as digital scribing and ambient AI scribes is transforming clinical documentation in healthcare. These AI-driven tools use natural language processing and machine learning to capture and transcribe patient-provider interactions in real time, generating structured notes for EHRs with minimal clinician input. By automating documentation, they alleviate one of healthcare’s most pressing challenges—clinician burnout caused by excessive EHR tasks that typically consume up to 60% of a physician’s workday .

Canada Digital Services 2025–2026 Market Insights™
The Canada Digital Services 2025–2026 Market Insights™ helps organizations identify key demand-side trends that are expected to have a lasting impact on digital projects in Canada. The report also highlights key challenges that enterprises face today.
Canada Digital Services: Accelerating Transformation, Strengthening Sustainability, and Driving Innovation
Canada’s digital services landscape is evolving rapidly as enterprises embrace AI, cybersecurity transformation, and cloud-first strategies to boost productivity and resilience. With increasing focus on upskilling to bridge the digital talent gap and partnerships with startups to deliver personalized experiences, Canadian firms are positioning themselves for sustained innovation. Additionally, strong government support for clean technologies and ESG-driven growth underscores Canada’s commitment to building a secure, sustainable, and digitally empowered economy.
Canada Digital Services 2025–2026 RadarView™
The Canada Digital Services 2025–2026 RadarView™ can help enterprises based in Canada craft a robust strategy based on regional outlook, best practices, and digital transformation. The report can also help them identify the right partners and service providers to accelerate their digital transformation. The 88-page report also highlights top market trends in Canada and Avasant’s viewpoint on them.