-

Hybrid Enterprise Cloud Services 2019-2020 RadarView™
The Hybrid Enterprise Cloud Services 2019 RadarView™ report addresses the need of the enterprises to become more aware of the need for IT environment modernization to enable true digital transformation. The report addresses the need of the enterprises to understand the key trends in the hybrid enterprise cloud space and to identify cloud system integrators (Cloud SIs) that can help migrate monolithic applications to the cloud and then manage the resulting environment optimally. Avasant evaluated 41 cloud SIs through a rigorous methodology across key dimensions of Practice Maturity, Partnership Ecosystem, and Investments and Innovation to finally recognize 24 cloud SIs that brought the most value to the market over the last 12 months.
December, 2019
-

Blockchain Services 2019 RadarView™
The Blockchain Services 2019 RadarView™ report addresses the need of enterprises to understand the right action points to navigate through the headwinds and gain competitive advantage. The 73-page report also identifies the key global service providers and system integrators that can help enterprises in blockchain adoption. The report also highlights the key trends in the market and Avasant’s view on the road ahead for Blockchain over the next 18-24 months.
October, 2019
-

Intelligent Automation Services 2019-2020 RadarView™
The Intelligent Automation Services 2019-2020 RadarView™ report is aimed at helping enterprises transition from RPA to cognitive automation, bring forward the capabilities developed by service providers to enable AI-led automation, and Avasant's viewpoint on the future direction of the industry over the next 12 to 18 months.
December, 2019
-

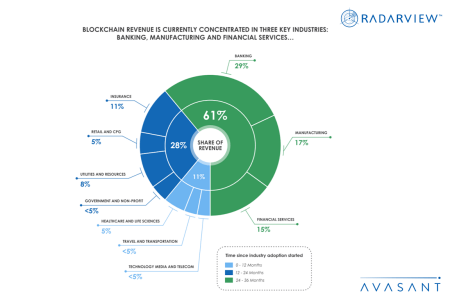
The Three Key Industries Blockchain Revenue Is Concentrated in – And How They’re Expanding
Banking, financial services and manufacturing, with nearly a 60% contribution to blockchain services revenue, are the adoption pioneers.
August, 2019
-

IT Spending and Staffing Benchmarks 2019/2020: Chapter 6: Banking and Finance Sector Benchmarks
Chapter 6 provides benchmarks for banking and financial services companies. The firms in this sector include commercial banks, investment banks, credit unions, mortgage lenders, consumer finance lenders, and other types of lenders and financial services providers. The 22 respondents in this sector range in size from a minimum of about $50 million to a maximum of $90 billion in annual sales. [Full Study Description]
July, 2019
-

IT Spending and Staffing Benchmarks 2019/2020: Chapter 7: Insurance Sector Benchmarks
Chapter 7 provides benchmarks for insurance companies. The firms in this sector include companies that sell medical and dental insurance, life insurance, property and casualty insurance, auto insurance, disability insurance, and other types of insurance. The 19 respondents in this sector range in size from a minimum of about $50 million to $35 billion in annual revenue. [Full Study Description]
July, 2019
-

IT Spending and Staffing Benchmarks 2019/2020: Chapter 23: Commercial Banking Subsector Benchmarks
Chapter 23 provides benchmarks for commercial banks. This subsector includes credit unions and community, regional, and national banks. The 16 respondents in this sample have annual revenue ranging from a minimum of about $50 million to $90 billion. [Full Study Description]
July, 2019
-

IT Spending and Staffing Benchmarks 2018/2019: Chapter 6: Banking and Finance Sector Benchmarks
Chapter 6 provides benchmarks for banking and finance companies. The firms in this sector include commercial banks, investment banks, credit unions, real estate investment firms, mortgage lenders, consumer finance lenders, and other types of lenders. The 23 respondents in this sector range in size from $22 million to a maximum of $90 billion in annual sales. (80 pp., 51 fig.) [Full Study Description]
June, 2018
-

IT Spending and Staffing Benchmarks 2018/2019: Chapter 7: Insurance Sector Benchmarks
Chapter 7 provides benchmarks for insurance companies. The firms in this sector include companies that sell medical and dental insurance, life insurance, property and casualty insurance, auto insurance, disability insurance, and other types of insurance. The 21 respondents in this sector range in size from $48 million to $35 billion in annual revenue. (80 pp., 51 fig.) [Full Study Description]
June, 2018
-

IT Spending and Staffing Benchmarks 2018/2019: Chapter 23: Commercial Banking Subsector Benchmarks
Chapter 23 provides benchmarks for commercial banks. This subsector includes credit unions and community, regional, and national banks. The 16 respondents in this sample have annual revenue ranging from $22 million to $90 billion. (50 pp., 30 fig.) [Full Study Description]
June, 2018
-

IT Spending and Staffing Benchmarks 2017/2018: Chapter 6: Banking and Finance Sector Benchmarks
Chapter 6 provides benchmarks for banking and finance companies. The firms in this sector include commercial banks, investment banks, credit unions, real estate investment firms, mortgage lenders, consumer finance lenders, and other types of lenders. The 27 respondents in this sector range in size from $22 million to a maximum of $34.1 billion in annual sales. [Full Study Description]
June, 2017
-

IT Spending and Staffing Benchmarks 2017/2018: Chapter 7: Insurance Sector Benchmarks
Chapter 7 provides benchmarks for insurance companies. The firms in this sector include companies that sell medical and dental insurance, life insurance, property and casualty insurance, auto insurance, disability insurance, and other types of insurance. The 19 respondents in this sector range in size from $48 million to $10.7 billion in annual revenue. [Full Study Description]
June, 2017
-

IT Spending and Staffing Benchmarks 2017/2018: Chapter 22: Commercial Banking Subsector Benchmarks
Chapter 22 provides benchmarks for commercial banks. This subsector includes credit unions and community, regional, and national banks. The 18 respondents in this sample have annual revenue ranging from $22 million to $34.1 billion. [Full Study Description]
June, 2017
-

IT Spending and Staffing Benchmarks 2016/2017: CHAPTER 6: Banking and Finance Sector Benchmarks
Chapter 6 provides benchmarks for banking and finance companies. The firms in this sector include commercial banks, investment banks, real estate investment firms, mortgage lenders, consumer finance lenders, and other types of lenders. The 25 respondents in this sector range in size from $60 million to a maximum of $34.1 billion in annual sales. (49 pp., 31 fig) [Full Study Description]
June, 2016
-

IT Spending and Staffing Benchmarks 2016/2017: CHAPTER 7: Insurance Sector Benchmarks
Chapter 7 provides benchmarks for insurance companies. The firms in this sector include medical and dental insurance companies, personal life insurance, corporate insurers, auto insurance, disability coverage providers, and other types of insurers. The 22 respondents in this sector range in size from $48 million to $10.5 billion in annual revenue. (49 pp., 31 fig) [Full Study Description]
June, 2016

 Grid View
 List View