-
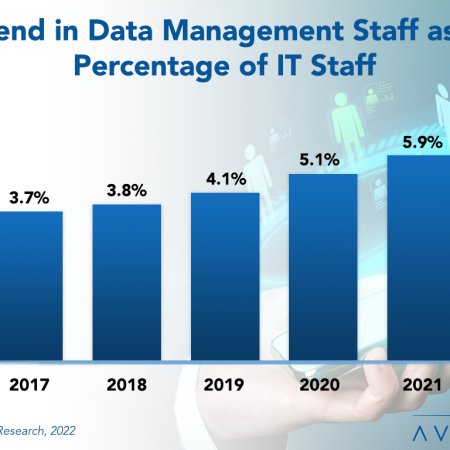
Exponential Data Growth Finally Spurs Demand for Data Management Staff
The data explosion continues to drive an increase in data management staffing. This Research Byte examines the reasons for the growing trend and provides a summary of our full report on data management staffing ratios.
April, 2022
-

Data Management Staffing Ratios
has increased significantly. In this study, we use four benchmarks to assess data management staffing levels: data management staff as a percentage of the IT staff, data management staff as a percentage of the Application Group, users per data management staff member, and applications per data management staff member.
April, 2022
-
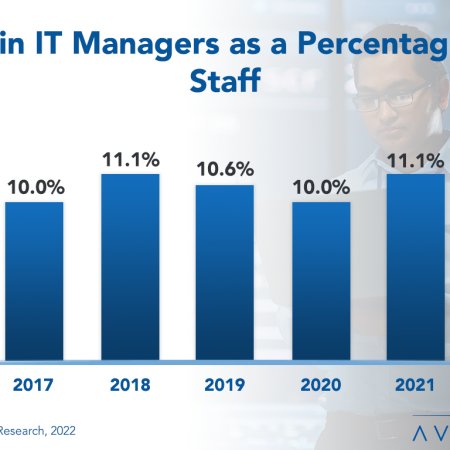
IT Manager Staffing Levels Show Volatility
The ratio of IT managers to total IT staff has been a volatile metric over recent years. In keeping with that trend, this staffing ratio took a jump this compared to last year. Although economic conditions can explain some of the volatility, there are other factors at work. This Research Byte examines possible causes.
January, 2022
-

IT Management and Administration Staffing Ratios 2022
When it comes to IT managers, it is important to find the sweet spot. Too many, and the IT group can become top-heavy and bureaucratic, too few and IT staff members can feel unsupported and without direction. This report examines how many IT managers a well-run IT organization typically requires, along with staffing metrics for two related administrative functions: IT finance/vendor management and administrative support. To benchmark IT management, we use two metrics: IT managers as a percentage of the IT staff and users per IT manager. We provide metrics for small, midsize, and large organizations. To provide further perspective, we consider the five-year trend in IT managers as an average percentage of the IT staff.
January, 2022
-
Database Administration Staffing Ratios 2021
As enterprises collect more data and connect more applications, they must ensure that data is secure, reliable, and accessible. But despite these increased demands, companies are restraining the growth in their database administration staff. This report helps IT managers determine whether they are keeping pace with industry standards by providing four benchmarks: database administrators (DBAs) as a percentage of the IT staff, DBAs as a percentage of the Data Center Group, users per DBA, and business applications per DBA. We present benchmarks for small, midsize, and large organizations and examine the influence by sector on these benchmarks. We conclude with best practices for optimizing DBA staffing.
October, 2021
-

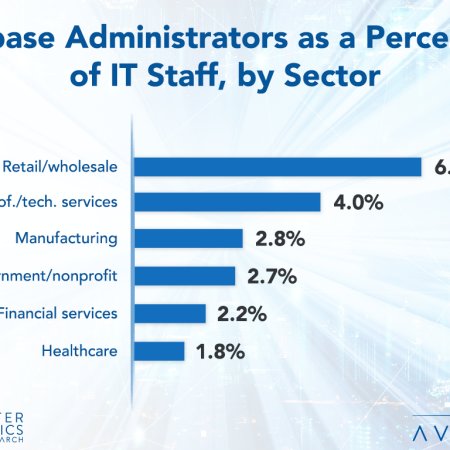
Retailers Feeling the Need for More Database Administrators
: While database administration (DBA) staffing remains steady or has declined in most sectors, the retail/wholesale sector has increased staffing in this area. The COVID-19 pandemic elevated the importance of an online presence in the retail/wholesale sector. This Research Byte provides a summary of our full report on database administration staffing ratios.
October, 2021
-
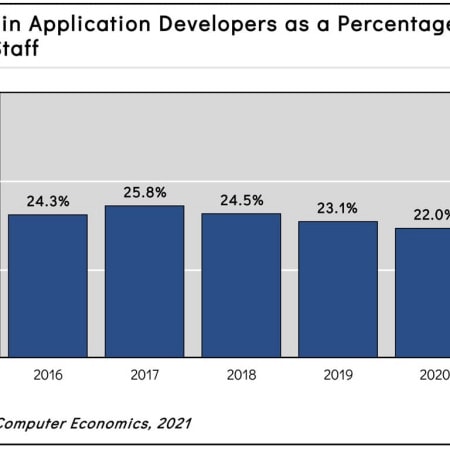
Factors Behind the Decline in Application Development Staffing
The way that enterprise applications are internally developed and maintained has changed, causing the ratio of application developers to dip again for the third straight year. App developers are some of the highest-paid IT personnel, so it is vital that IT leaders periodically assess this staffing ratio. This research byte summarizes our full report, Application Developer Staffing Ratios.
February, 2021
-

Application Developer Staffing Ratios 2021
The way that enterprise applications are internally developed and maintained has changed. With these changes, the need for application developers is in flux, and IT organizations can benefit from a periodic assessment of their staffing levels. This report uses three metrics to make that assessment: developers as a percentage of the IT staff, users per developer, and applications per developer. We provide benchmarks for the composite sample, by organization size and by sector. We also provide a benchmark for the larger Application Group, which includes personnel engaged in web development and support, quality assurance, data management, and business systems analysis.
February, 2021
-

Journey to the Cloud—The Long and Winding Road
Would it surprise you to discover out that, for most companies, they’ve barely started the cloud transition? Modern-day SaaS providers as we know them today have been around since just before the turn of the century. Amazon Web Services and other public cloud services are at least a decade old. But according to the Computer Economics annual IT Spending and Staffing Benchmarks study for 2019/2020, the cloud transition still has a long way to go.
July, 2019
-

If IT Budgets Are Growing in 2019, Why Aren’t IT Headcounts?
IT operational budgets are growing for companies of all sizes in 2019, but that growth is not being mirrored in IT staffing levels, which are essentially flat at the median. According to Computer Economics, fewer than half (46%) of all companies are planning to increase IT head count. At the same time, the economy is strong and we do not see widespread layoffs of IT personnel on the horizon. This Research Byte explores the reason for this apparent contradiction.
July, 2019
-
Application Programmer Staffing Ratios 2015
With the changing IT environment, the need for application programmers is in flux, and IT organizations can benefit from periodic assessment of their staffing levels. This study uses three metrics to make that assessment: programmers as a percentage of the IT staff, users per programmer, and applications per programmer. We provide benchmarks for the composite sample, by organization size, and by sector. We also provide a benchmark for the larger application group, which includes personnel engaged in web development and support, quality assurance and testing, data management, and business systems analysis. (17 pp., 7 fig.) [Research Byte]
May, 2015
-

IT Management Staffing Ratios 2014
This study examines the question of how many managers a well-run IT organization requires and presents staffing metrics for IT managers as well as two administrative support functions: IT finance/vendor management and clerical support. To benchmark IT management, we use two metrics: IT managers as a percentage of the IT staff and users per IT manager. We provide metrics for small, midsize, and large organizations. To provide further perspective, we consider the five-year trend in IT managers as an average percentage of the IT staff. We also report metrics for IT finance and clerical staff. (16 pp., 8 fig.) [Research Byte]
April, 2014
-

Application Programmer Staffing Ratios 2014
The need for application programmers is in flux, and IT organizations can benefit from periodic assessment of their staffing levels. This study uses three metrics to make that assessment: programmers as a percentage of the IT staff, users per programmer, and applications per programmer. We provide benchmarks for the composite sample, by organization size, and by sector. We also provide a benchmark for the larger application group, which includes personnel engaged in web development and support, quality assurance and testing, data management, and business systems analysis. (17 pp., 7 fig.) [Research Byte]
March, 2014
-

IT Management Staffing Ratios 2013
This study examines the question of how many managers a well-run IT organization requires and presents staffing metrics for IT managers as well as two administrative support functions: IT finance and vendor management, and clerical support. To benchmark IT management, we use two metrics: IT managers as a percentage of the IT staff and users per IT manager. We provide metrics for small, midsize, and large organizations. To provide further perspective, we consider the five-year trend in IT managers as an average percentage of the IT staff. We also report metrics for IT finance and clerical staff. (11 pp., 8 Figs) [Research Byte]
May, 2013
-

Server Support Staffing Ratios 2012
Server consolidation, data center automation, and virtualization are all working to change the equation on optimum server support staffing levels. In this study on server support staffing ratios we first look at the four-year trend in the percentage of server support staff in relation to the IT staff. Next we provide four metrics for benchmarking server support staff: server support staff as a percentage of the IT staff, server support staff as a percentage of the infrastructure support group, physical servers per server support staff member, and OS instances per server support staff member. We provide these metrics for small, midsize, and large organizations. We also assess how industry sector can influence server support staffing ratios. We conclude with recommendations for improving server support personnel productivity. (17 pp., 9 Figs.) [Research Byte]
August, 2012

 Grid View
 List View