-
![IT Security and Cybersecurity Spending Benchmarks—Download Free Sample Pages IT Security Cybersecurity and Compliance Spending Benchmarks - IT Security and Cybersecurity Spending Benchmarks—Download Free Sample Pages]()
IT Security and Cybersecurity Spending Benchmarks—Download Free Sample Pages
Security and cybersecurity incidents are costly, with losses increasing every year. No wonder, then, that our research shows IT security and cybersecurity are the top priority for new IT investments year after year. But how much is enough?
May, 2023
-
![IT Security, Cybersecurity, and Compliance Spending Benchmarks 2023 IT Security Cybersecurity and Compliance Spending Benchmarks - IT Security, Cybersecurity, and Compliance Spending Benchmarks 2023]()
IT Security, Cybersecurity, and Compliance Spending Benchmarks 2023
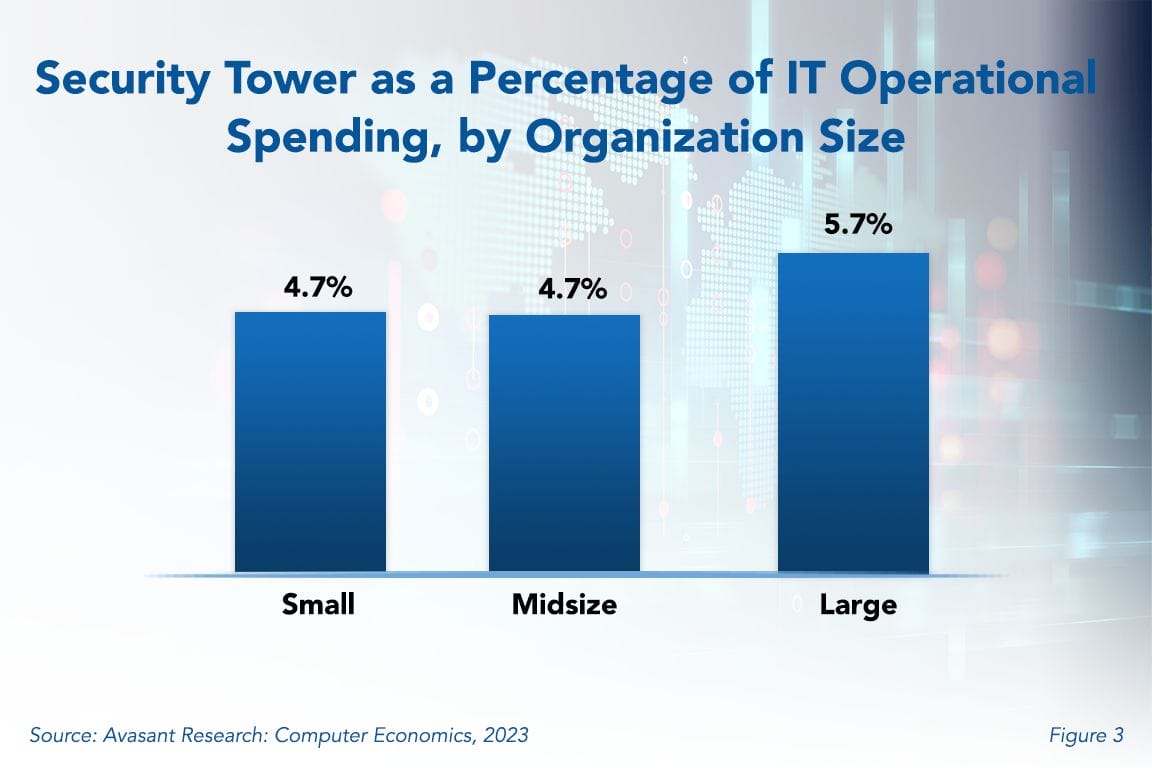
Security and cybersecurity incidents are costly, with losses increasing every year. It is no wonder, then, that organizations continually rank security as a top priority for new spending. But how much are they spending? This report provides spending and staffing benchmarks by industry and organization size for IT security, cybersecurity, and related compliance. Benchmarks are calculated by number of users, organization revenue, and percentage of IT spending, as well as by number of network devices, locations, and endpoints. Security staffing is calculated as a percentage of the IT staff and also per user. Industry benchmarks are provided for business services, financial services, critical infrastructure, public sector, healthcare, manufacturing/distribution, and retail. There is also a breakdown for identity/access management, security policy/awareness, cybersecurity/incident response, threat and vulnerability management, data privacy/security, and governance, risk, and compliance.
May, 2023
-
![IT Security, Cybersecurity, and Compliance Spending Benchmarks 2022 Security Tower 2 - IT Security, Cybersecurity, and Compliance Spending Benchmarks 2022]()
IT Security, Cybersecurity, and Compliance Spending Benchmarks 2022
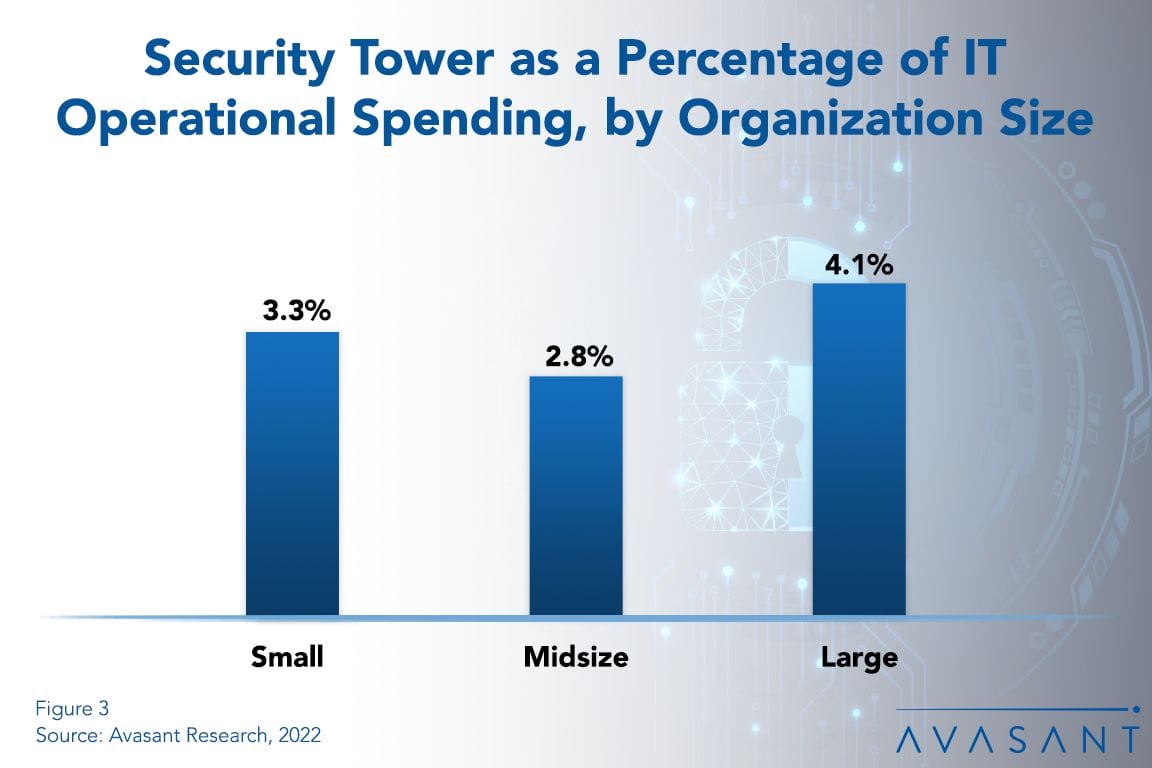
Security and cybersecurity incidents are costly, with losses increasing every year. It is no wonder, then, that organizations continually rank security as a top priority for new spending. But how much are they spending? This report provides spending and staffing benchmarks by industry and organization size for IT security, cybersecurity, and related compliance. Benchmarks are calculated by number of users, organization revenue, and percentage of IT spending, as well as by number of network devices, locations, and endpoints. Security staffing is calculated as a percentage of the IT staff and also per user. Industry benchmarks are provided for business services, financial services, critical infrastructure, public sector, healthcare, manufacturing/distribution, and retail. There is also a breakdown for identity/access management, security policy/awareness, cybersecurity/incident response, threat and vulnerability management, data privacy/security, and governance, risk, and compliance.
February, 2022
-
![European IT Spending and Staffing Benchmarks 2020-2021: Chapter 8, Food and Beverage Subsector ISSEurope2020 21Chapter8 - European IT Spending and Staffing Benchmarks 2020-2021: Chapter 8, Food and Beverage Subsector]()
European IT Spending and Staffing Benchmarks 2020-2021: Chapter 8, Food and Beverage Subsector
Chapter 8 provides benchmarks for food and beverage manufacturers. The 14 respondents in the sample range in size from about €50 million to €26 billion in annual revenue. Food and beverage companies produce beverages, snack foods, meat products, seafood products, vegetables, dairy products, dietary supplements, pet food, and other consumable food products. Some are suppliers to other food manufacturers or to the food service industry, while many also distribute consumer products to retailers or directly to consumers. (38 pp., 21 fig.)
December, 2020
-
![IT Spending and Staffing Benchmarks 2020-2021: Chapter 21: Food and Beverage Subsector Benchmarks ISs2020 21Chapter21 - IT Spending and Staffing Benchmarks 2020-2021: Chapter 21: Food and Beverage Subsector Benchmarks]()
IT Spending and Staffing Benchmarks 2020-2021: Chapter 21: Food and Beverage Subsector Benchmarks
Chapter 21 provides benchmarks for food and beverage manufacturers. The 16 respondents in the sample range in size from $145 million to $2.2 billion in annual revenue. Food and beverage companies produce beverages, snack foods, meat products, seafood products, vegetables, dairy products, dietary supplements, and other consumable food products. Some are suppliers to other food manufacturers or to the food service industry, while many also distribute consumer products to retailers or direct to consumers. (49 pp., 30 fig.)
July, 2020
-
![European IT Spending and Staffing Benchmarks 2021/2022: Chapter 2: Composite Benchmarks EUISS2021Ch2 - European IT Spending and Staffing Benchmarks 2021/2022: Chapter 2: Composite Benchmarks]()
European IT Spending and Staffing Benchmarks 2021/2022: Chapter 2: Composite Benchmarks
This chapter provides composite metrics for all of the organizations surveyed, across all industry sectors and organization sizes. The key metrics provided in this chapter are listed in the Key Metrics Descriptions section
September, 2021
-
![European IT Spending and Staffing Benchmarks 2021/2022: Full Study EUISS2021Full - European IT Spending and Staffing Benchmarks 2021/2022: Full Study]()
European IT Spending and Staffing Benchmarks 2021/2022: Full Study
This report is a companion study to our annual IT Spending and Staffing Benchmarks study, which provides a full set of IT budgetary benchmarks and IT staffing metrics by industry sector and organizational size. This companion study for Europe should be used in conjunction with our full study to provide insight into how high-level spending and staffing benchmarks differ for European organizations.
September, 2021
-
![European IT Spending and Staffing Benchmarks 2021/2022: Chapter 3B: Midsize Organization Benchmarks EUISS2021Ch3b - European IT Spending and Staffing Benchmarks 2021/2022: Chapter 3B: Midsize Organization Benchmarks]()
European IT Spending and Staffing Benchmarks 2021/2022: Chapter 3B: Midsize Organization Benchmarks
Chapter 3B provides benchmarks for midsize organizations, across all sectors. Midsize organizations are defined as organizations having IT operational budgets of $5 million to less than $20 million. Despite the fact that this is a European study, we determined organization size in US dollars. This was to ensure an apples-to-apples size comparison between our main study and the European companion study. All metrics in the study are reported in euros.
September, 2021
-
![European IT Spending and Staffing Benchmarks 2021/2022: Chapter 3A: Small Organization Benchmarks EUISS2021Ch3a - European IT Spending and Staffing Benchmarks 2021/2022: Chapter 3A: Small Organization Benchmarks]()
European IT Spending and Staffing Benchmarks 2021/2022: Chapter 3A: Small Organization Benchmarks
Chapter 3A provides benchmarks for small organizations, across all sectors in Europe. Small organizations are defined as organizations having IT operational budgets of of of less than $5 million.
September, 2021
-
![European IT Spending and Staffing Benchmarks 2021/2022: Chapter 1: Executive Summary EUISS2021Ch1 - European IT Spending and Staffing Benchmarks 2021/2022: Chapter 1: Executive Summary]()
European IT Spending and Staffing Benchmarks 2021/2022: Chapter 1: Executive Summary
This chapter provides an overview of the key findings from the European study and describes the contents of the subsequent chapters. It also includes information on the study participants and the survey methodology.
September, 2021
-
![European IT Spending and Staffing Benchmarks 2021/2022: Chapter 3C: Large Organization Benchmarks EUISS2021Ch3c - European IT Spending and Staffing Benchmarks 2021/2022: Chapter 3C: Large Organization Benchmarks]()
European IT Spending and Staffing Benchmarks 2021/2022: Chapter 3C: Large Organization Benchmarks
Chapter 3C provides benchmarks for large organizations, across all sectors. Large organizations are defined as organizations having IT operational budgets of more than $20 million. Despite the fact that this is a European study, we determined organization size in US dollars. This was to ensure an apples-to-apples size comparison between our main study and the European companion study. All metrics in the study are reported in euros.
September, 2021
-
![European IT Spending and Staffing Benchmarks 2021/2022: Chapter 4: Process Manufacturing EUISS2021Ch4 - European IT Spending and Staffing Benchmarks 2021/2022: Chapter 4: Process Manufacturing]()
European IT Spending and Staffing Benchmarks 2021/2022: Chapter 4: Process Manufacturing
Chapter 4 provides benchmarks for process manufacturers. Process manufacturers are defined as those where the production process adds value by mixing, separating, forming, or chemical reaction. The sector includes manufacturers of chemicals, petrochemicals, pharmaceuticals, cosmetics, dietary supplements, food and beverage products, building materials, packaging materials, steel, glass, paper products, and other process-manufactured goods. The 49 respondents in the sample range in size from a minimum of €90 million to a maximum of above €21 billion in annual revenue.
September, 2021


