
Areas of Interest
Content Type
Industries
- Aerospace and defense
- Banking, Financial Services, and Insurance
- Energy and Resources
- Federal Government
- Healthcare and life sciences
- High-tech and telecommunications
- Higher Education
- Media and entertainment
- Private equity
- Public Sector
- Retail and manufacturing
- Social Impact Institutions
- Travel and transportation
Technologies
- Artificial Intelligence
- Automation
- Blockchain
- Business and data analytics
- Cloud
- Customer relationship management (CRM)
- Cybersecurity
- Digital Services
- Enterprise resource planning (ERP)
- Human capital management (HCM)
- Internet Of Things
- Machine Learning
- Networking
- Supply chain management (SCM)
- Virtual reality/Augmented reality
Areas of Interest
Latest Reports

Finance and Accounting Budgets, Staffing, and Process Metrics 2025/2026: Chapter 3B: Very Large Size Organizations
In these chapters, we provide a complete set of benchmarks for organizations within the specified size classification.

Finance and Accounting Budgets, Staffing, and Process Metrics 2025/2026: Chapter 3A: Mid-Large Size Organizations
In these chapters, we provide a complete set of benchmarks for organizations within the specified size classification.
Finance and Accounting Budgets, Staffing, and Process Metrics 2025/2026: Chapter 2: Composite Business Process Metrics
This chapter provides composite metrics for all survey respondents across all sectors and organization sizes.

Finance and Accounting Budgets, Staffing, and Process Metrics 2025/2026: Chapter 1: Executive Summary
This chapter provides an overview of the key findings from the full study and describes the contents of the subsequent chapters.

Beyond Scale: How AgreeYa Accelerates Computacenter’s Move Up the Services Value Chain
This paper examines Computacenter’s acquisition of AgreeYa as a strategic move to accelerate its progression up the IT services value chain. Beyond expanding geographic presence in North America, the deal materially strengthens Computacenter’s digital engineering, application modernization, and professional services capabilities across the US and India. The paper analyzes how AgreeYa complements Computacenter’s infrastructure-led strengths, supports earlier engagement in enterprise transformation programs, and enhances competitiveness in complex, multitower deals. It also outlines the implications for enterprise buyers seeking integrated infrastructure and digital transformation partners.

Fair Market Value Report January 2026
The Computer Economics Market Value Reports provide information on the most commonly traded machines and systems at the time the report is published. The values shown are the composites of a range of quotes acquired from sources within the industry deemed reliable, accuracy of the information presented is not guaranteed. Resources are eBay, Insight, NewEgg, CDW, ETB-Tech, Amazon, Savemyserver, TheServerStore, LoadBalancer, NetworkOutlet, Netsyst-Direct, TigerDirect, and others as well as online sales companies and appraisals.

ServiceNow’s Veza and Armis Acquisitions Solidify Foundations for Enterprise AI Security
This paper analyzes ServiceNow’s acquisitions of Veza and Armis through the lens of enterprise AI risk, governance, and security readiness. As organizations scale generative AI and agentic AI, gaps in identity governance and exposure management are emerging as structural constraints rather than tactical security issues. By integrating Veza’s identity access intelligence and Armis’ predictive exposure management into its platform, ServiceNow is positioning itself to address these constraints holistically. The paper assesses the strategic implications of this convergence and its potential to reshape how enterprises govern, secure, and operationalize AI at scale.
Residual Value Forecast January 2026
Our quarterly Residual Value Forecast (RVF) report provides forecasts for the following categories of IT equipment: desktop computers, laptops, network equipment, printers, servers, storage devices, and other IT equipment. It also includes residual values for other non-IT equipment in the following categories: copiers, material handling equipment (forklifts), mail equipment, medical equipment, test equipment, and miscellaneous equipment such as manufacturing machinery and NC machines. Residual Value Forecasts are provided for five years for end-user, wholesale, and orderly liquidation values (OLV) prices.

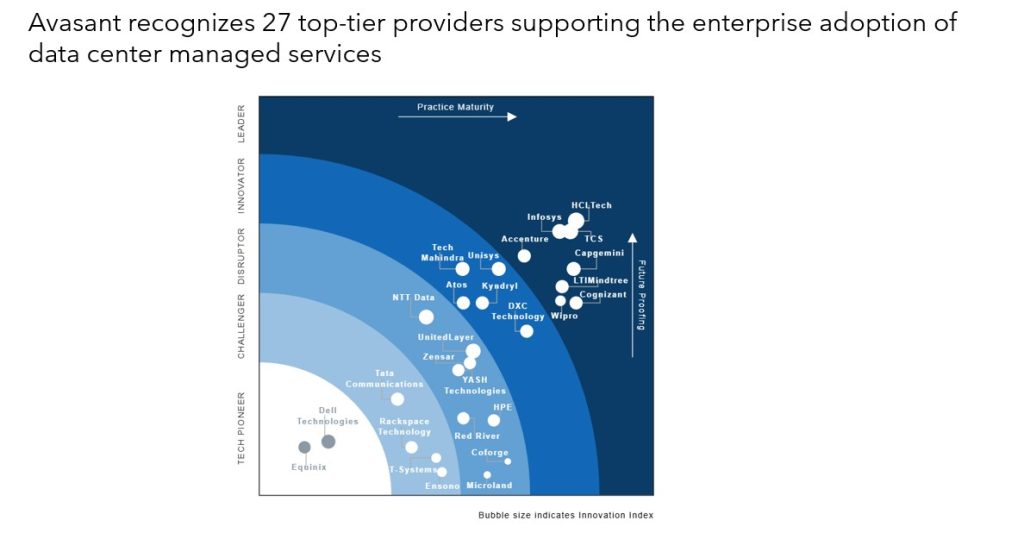
Data Center Managed Services 2025–2026 Market Insights™
The Data Center Managed Services 2025–2026 Market Insights™ assists organizations in identifying important demand-side trends that are expected to have a long-term impact on any data center management project. The report also highlights key implementation challenges that enterprises face today
Reimagining Data Centers to be AI-Ready, Sovereign, and Sustainable
AI is reshaping how data centers operate by driving automation and improving operational efficiency, and at the same time, it is encouraging businesses to build facilities that can accommodate AI’s high compute demands with liquid cooling and modular power. Sustainability is now central, with enterprises adopting advanced energy monitoring, carbon emissions reduction practices, and circular IT models to meet ESG goals. Service providers are responding through generative AI, agentic AI, and AIOps-driven solutions to deliver resilience, efficiency, and accelerated modernization. Both demand-side and supply-side trends are covered in our Data Center Managed Services 2025–2026 Market Insights™ and Data Center Managed Services 2025–2026 RadarView™, respectively.