-

European IT Spending and Staffing Benchmarks 2023/2024: Chapter 5: Discrete Manufacturing Sector Benchmarks
Chapter 5 provides benchmarks for discrete manufacturing organizations. Discrete manufacturers are defined as those where the production process adds value by fabricating or assembling individual (discrete) unit production. The category includes manufacturers of consumer products, athletic equipment, industrial equipment, telecommunications equipment, aerospace products, furniture, auto parts, electrical parts, medical devices, and electronic devices, among other products. The 44 respondents in this sample range in size from a minimum of about €75 million to over €200 billion in annual revenue.
September, 2023
-

European IT Spending and Staffing Benchmarks 2023/2024: Chapter 21: Brick and Mortar Retail Subsector Benchmarks
Chapter 21 provides benchmarks for brick-and-mortar retailers. This subsector includes department stores, clothing stores, convenience stores, pet stores, pharmacies, hardware stores, nonprofit retailers, furniture retailers, agricultural retailers, and other retailers. The 34 respondents in this sample have annual revenue ranging from about €95 million to over €25 billion.
September, 2023
-

European IT Spending and Staffing Benchmarks 2023/2024: Chapter 6: Banking and Finance Sector Benchmarks
Chapter 6 provides benchmarks for banking and financial services companies. The firms in this sector include commercial banks, investment banks, mortgage lenders, consumer finance lenders, and other types of lenders and financial services providers. The 17 respondents in this sector range in size from a minimum of about €100 million to over €30 billion in annual sales.
September, 2023
-

European IT Spending and Staffing Benchmarks 2023/2024: Chapter 22: Online Retail Subsector Benchmarks
Chapter 22 provides benchmarks for online retailers. This subsector includes clothing retailers, home furnishing retailers, dietary supplements and health products retailers, agricultural retailers, pharmaceutical retailers, educational products retailers, sports equipment retailers, and other online retailers. The 15 respondents in this sample have annual revenue ranging from about €100 million to about €20 billion.
September, 2023
-

European IT Spending and Staffing Benchmarks 2023/2024: Chapter 7: Insurance Sector Benchmarks
Chapter 7 provides benchmarks for insurance companies. The firms in this sector include companies that sell healthcare insurance, life insurance, property and casualty insurance, auto insurance, disability insurance, insurance marketplaces, and other types of insurance. The 15 respondents in this sector range in size from a minimum of about €60 million to over €8 billion in annual revenue.
September, 2023
-

European IT Spending and Staffing Benchmarks 2023/2024: Chapter 23: Professional Services Subsector Benchmarks
Chapter 23 provides benchmarks for professional services organizations. The 31 respondents in the sample range in size from a minimum of about €50 million to over €50 billion in annual revenue. The sector includes firms that provide professional services, including legal, accounting, financial advice, consulting, marketing, and other services.
September, 2023
-

European IT Spending and Staffing Benchmarks 2023/2024: Chapter 8: Retail Sector Benchmarks
Chapter 8 provides benchmarks for retailers. This sector includes retailers of clothing, jewelry, hardware, furniture, electronics, sports equipment, groceries, pharmaceuticals, and general merchandise. They include restaurant chains, department stores, luxury retail stores, electronics stores, furniture stores, pharmacies, sporting goods stores, and specialty retailers. We also include hospitality and consumer services in this sector. The 43 respondents in the sample range in size from about €90 million to over €30 billion in annual revenue.
September, 2023
-

European IT Spending and Staffing Benchmarks 2023/2024: Chapter 9: Wholesale Distribution Sector Benchmarks
Chapter 9 provides benchmarks for wholesale distributors. The category includes wholesale distributors of building products, home improvement products, auto parts, industrial components, fuel supply, electronics, food and beverage, pharmaceuticals, and other products. The 18 respondents in the sample range in size from a minimum of about €60 million to €30 billion in revenue.
September, 2023
-

European IT Spending and Staffing Benchmarks 2023/2024: Chapter 10: Energy and Utilities Sector Benchmarks
Chapter 10 provides benchmarks for public utilities, oil and gas producers, service companies, and midstream distributors across all organization sizes. The 18 respondents in this sector include public utilities (water, gas, and electric), regional utilities, integrated energy companies, natural gas companies, pipeline operators, and other energy and utilities companies. The companies in our sample range in size from a minimum of about €150 million to more than €100 billion in annual revenue.
September, 2023
-

European IT Spending and Staffing Benchmarks 2023/2024: Chapter 11: Healthcare Services Sector Benchmarks
Chapter 11 provides benchmarks for healthcare services companies. The 15 respondents in this sector include community hospital groups, national and regional hospital systems, healthcare systems, long-term care facilities, and other healthcare organizations. These organizations range in size from a minimum of about €50 million to over €15 billion in annual revenue.
September, 2023
-
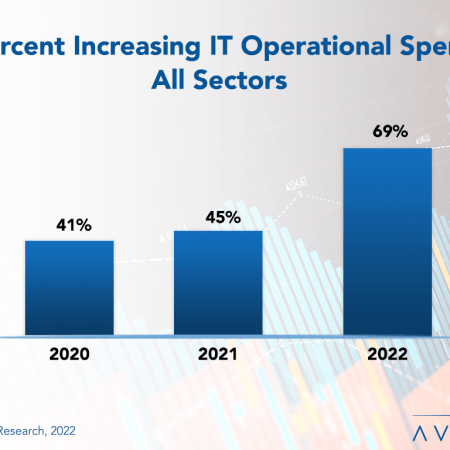
Tough Times in Europe Call for IT Budget Growth
In recent years, Europe has been hit by a pandemic, double-digit inflation, and a war. The subsequent supply chain disruptions, shortages of food and fuel, and looming recession do not make anything any easier for IT organizations on the continent. Still, IT budgets are rising. Not necessarily at the pace of rampant inflation. But still more than typical in times of economic contraction. It is starting to become clear that most enterprises now view IT as a strategic resource in weathering uncertainty. IT is no longer seen as a cost center but as a strategic resource that can impact the top and bottom lines. This research byte is a brief description of some of the findings in our European IT Spending and Staffing Benchmarks 2022/2023 study.
September, 2022
-

European IT Spending and Staffing Benchmarks 2022/2023: Chapter 17: Industrial and Automotive Subsector Benchmarks
Chapter 17 provides benchmarks for industrial and automotive manufacturers. The 20 respondents in this subsector make auto parts, material handling equipment, engines, machinery, vehicles, and similar capital goods. The manufacturers in the sample range in size from €120 million to over €250 billion in annual revenue.
September, 2022
-

European IT Spending and Staffing Benchmarks 2022/2023: Chapter 16: Food and Beverage Subsector Benchmarks
Chapter 16 provides benchmarks for food and beverage manufacturers. The 19 respondents in the sample range in size from €100 million to over €25 billion in annual revenue. Food and beverage companies produce beverages, meat products, seafood products, dairy products, dietary supplements, bakery ingredients, and other consumable food products. Some are suppliers to other food manufacturers or to the food service industry, while many also distribute consumer products to retailers or direct to consumers.
September, 2022
-

European IT Spending and Staffing Benchmarks 2022/2023: Chapter 15: IT Services and Solutions Sector Benchmarks
Chapter 15 provides IT spending and staffing statistics for the IT services and solutions sector. The category includes software companies, software-as-a-service providers, systems integrators, IT solution providers, business process outsourcing firms, and other providers of technology services and solutions. There are 23 organizations in the sample, ranging in size from around €13 million to over €25 billion in annual revenue.
September, 2022
-

European IT Spending and Staffing Benchmarks 2022/2023: Chapter 14: Construction and Trade Services Sector Benchmarks
Chapter 14 provides benchmarks for construction and trade services companies. The 13 respondents in the sample range in size from about €60 million to over €20 billion in annual revenue. The category includes engineering and construction companies, commercial, residential, and industrial construction contractors, ship builders, specialty contractors, environmental services firms, and other construction and trade services firms.
September, 2022

 Grid View
 List View