-

High-Tech Industry Digital Services 2021–2022 RadarView™
The High-Tech Industry Digital Services 2021–2022 RadarView™ addresses the need for enterprises to understand the right action points to gain competitive advantage. It also identifies key service providers and system integrators that can help enterprises in their business transformation. It also brings out detailed capability and experience analyses of leading vendors to assist high-tech companies in identifying strategic partners for their digital transformation journeys. The 91-page report also highlights key industry trends and the industry outlook in the high-tech space and Avasant’s viewpoint on them.
October, 2021
-
IT Spending and Staffing Benchmarks 2021/2022: Chapter 10: Energy and Utilities Sector Benchmarks
Chapter 10 provides benchmarks for public utilities, oil and gas producers, service companies, and midstream distributors across all organization sizes. The 21 respondents in this sector include public utilities (water, gas, and electric), integrated energy companies, upstream exploration and production companies, natural gas companies, pipeline operators, and other energy and utilities companies.
July, 2021
-
IT Spending and Staffing Benchmarks 2021/2022: Chapter 20: High-Tech Subsector Benchmarks
Chapter 20 provides benchmarks for high-tech companies. The category includes computer products manufacturers, telecommunications equipment manufacturers, semiconductor manufacturers, aerospace and defense manufacturers, pharmaceutical makers, biotechnology product makers, software developers, software-as-a-service providers, and other high-tech companies. The 28 respondents in this sample range in size from a minimum of about $50 million to $80 billion in revenue.
July, 2021
-

Quantum Computing Coming Sooner Than You Think
The slow pace of quantum development has inspired enterprises to take a “wait and watch” strategy for quantum applications. Increasing the number of qubits while reducing the noise or error correction is the most critical challenge in quantum computing. However, the next five years will be crucial in the development of quantum computers. So now is time to build partnerships and identify pilot programs for when quantum computing becomes affordable and accessible to your size and type of organization.
May, 2021
-

US Aerospace & Defense Digital Services 2021-2022 RadarView™
The US Aerospace & Defense Digital Services 2021–2022 RadarViewTM report addresses the need for enterprises to understand the right action points to gain competitive advantage. It also identifies key service providers and system integrators serving in the United States that can help enterprises in their business transformation. It also brings out detailed capability and experience analyses of leading vendors to assist aerospace and defense companies in identifying strategic partners for their digital transformation journeys. The 84-page report also highlights key industry trends and the industry outlook in the aerospace and defense space and Avasant’s viewpoint on them.
May, 2021
-
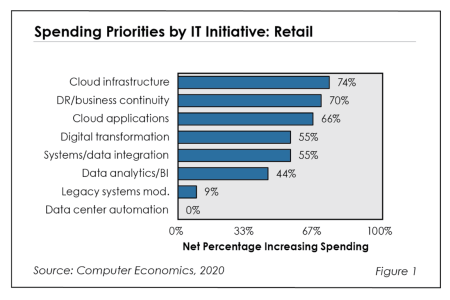
Retail IT Spending Needed for Digital Transformation
The retail sector is going through a major transformation. Brick-and-mortar stalwarts are filing for bankruptcy or disappearing entirely. E-commerce and the digital customer experience are taking an increasing part of the shopping dollar. And all of that was happening before the COVID-19 pandemic forced major restrictions on brick-and-mortar shopping. Traditional retail is in a “change or die” mode, and the transformation of IT is going to decide who survives. This Research Byte is a brief summary of our special report on IT spending trends in the retail sector, which is available for free download.
October, 2020
-

GCC Region Digital Services 2020-2021 RadarView™
The GCC Region Digital Services 2020-2021 RadarView™ report addresses GCC enterprises' needs and helps them identify and adopt the right technologies combined with appropriate implementation strategies. The 120-page report also identifies the key service providers and system integrators that can help these enterprises in business transformation.
October, 2020
-

Envisioning The Future Of Education
The education sector, across both higher education and schools in the US and UK, is in the midst of long-term change that has accelerated with the pandemic in 2020. Technology adoption will be fundamental to the ongoing and impending transformation in the industry. This report identifies the key trends in education and highlights the role of technology in enabling a new future. This report is based on inputs from nearly 90 academic and technology leaders from universities and schools across the US and UK.
August, 2020
-
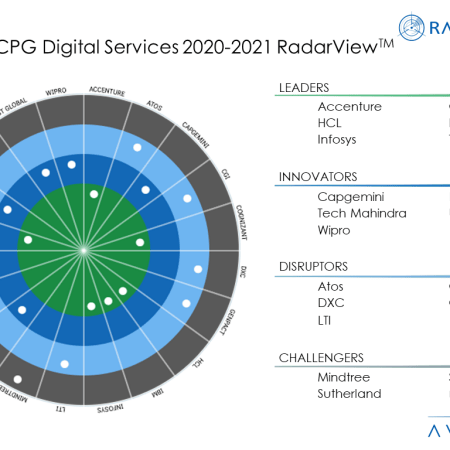
How Service Providers Can Help Retailers, CPG Firms Navigate the COVID Seas
In one of the most visible outcomes of the COVID-19 pandemic and following recession, more than 8,000 brick-and-mortar stores have closed this year. However, online sales have skyrocketed, growing four times the growth rate of offline sales in the first quarter of 2020.
August, 2020
-

Transformation in the Utilities Sector Is a Requirement, Not an Option
Read Avasant’s "Transformation in the Utilities Sector Is a Requirement, Not an Option" article to find out how Utilities industry, that has typically had difficulty in adapting to rapid changes, can both culturally and technologically, address these challenges.
August, 2019
-
IT Spending and Staffing Benchmarks 2017/2018: Chapter 18: Education Sector Benchmarks
Chapter 18 provides benchmarks for the education sector. The sector includes public and private colleges and universities, for-profit institutions, and school districts. The 22 respondents in the sample have operating budgets ranging in size from $66 million to $6.7 billion.[Full Study Description]
June, 2017
-

Life Science IT Spending Driven by Greater Infrastructure Requirements
As with many high-tech enterprises, life science companies make considerable investments in information technology. This Research Byte outlines four key findings from our comparative analysis of the IT spending in life sciences organizations.
April, 2012
-

Comparative Analysis of IT Spending in the Life Sciences
As with many high-tech enterprises, life science companies make considerable investments in information technology. In this study, we look at IT spending and staffing in the life science sector by comparing key, high-level metrics against a broad sample of organizations. For the comparative analysis, we use three measures of IT intensity: IT spending a percentage of revenue, IT spending per user, and application spending per user. To determine where spending differs, we break down IT spending into five functional areas: IT management, applications, data center, network, and end-user support. We also examine IT staff headcount by those same functional areas. We conclude with our assessment of where life science organizations should focus their efforts to improve IT performance. (13 pp., 6 figs.)[Research Byte]
April, 2012

 Grid View
 List View