-
![Internet of Things Services: Transforming Industries and Enriching Lives Moneyshot 2 - Internet of Things Services: Transforming Industries and Enriching Lives]()
Internet of Things Services: Transforming Industries and Enriching Lives
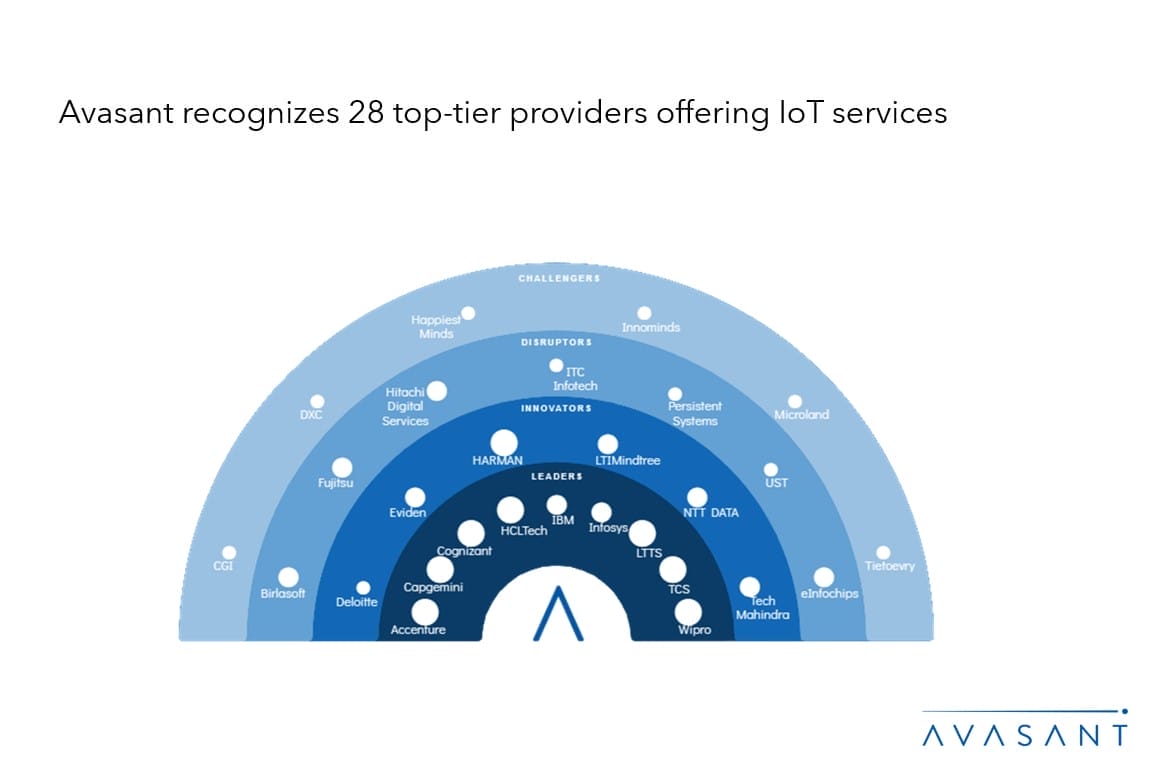
In 2023, the Internet of Things (IoT) industry saw an 18% revenue growth, with more projects transitioning to the production stage. Industrial IoT remains at the forefront of IoT service adoption, driven by use cases such as predictive maintenance, asset management, and remote monitoring. This growth is supported by technological progress, including the amalgamation of edge computing with AI, analytics, and 5G for faster decision-making and increased efficiency. Moreover, the progression of digital twin technology is becoming crucial, impacting a range of applications from product development to addressing global issues such as climate change and supply chain disruptions.
April, 2024
-
![Oracle's Bold Move: Freely Embedding Gen AI in Business Apps Oracle Product Image - Oracle's Bold Move: Freely Embedding Gen AI in Business Apps]()
Oracle’s Bold Move: Freely Embedding Gen AI in Business Apps
NEWPORT BEACH, Calif. — Generative AI (Gen AI) is rapidly transforming industries, and Oracle, a major player in the enterprise technology market, is making a bold move. It is offering its base Gen AI capabilities across its suite of business applications, including Fusion Cloud Applications Suite and NetSuite, at no additional cost.
April, 2024
-
![Residual Value Forecast April 2024 Value Forecast Format - Residual Value Forecast April 2024]()
Residual Value Forecast April 2024
Our quarterly Residual Value Forecast (RVF) report provides forecasts for the following categories of IT equipment: desktop computers, laptops, network equipment, printers, servers, storage devices, and other IT equipment. It also includes residual values for other non-IT equipment in the following categories: copiers, material handling equipment (forklifts), mail equipment, medical equipment, test equipment, and miscellaneous equipment such as manufacturing machinery and NC machines. Residual Value Forecasts are provided for five years for end-user, wholesale, and orderly liquidation values (OLV) prices.
April, 2024
-
![Driving Technological Advancements in the Manufacturing Industry MoneyShot View Manufacturing Digital Services 2024 - Driving Technological Advancements in the Manufacturing Industry]()
Driving Technological Advancements in the Manufacturing Industry
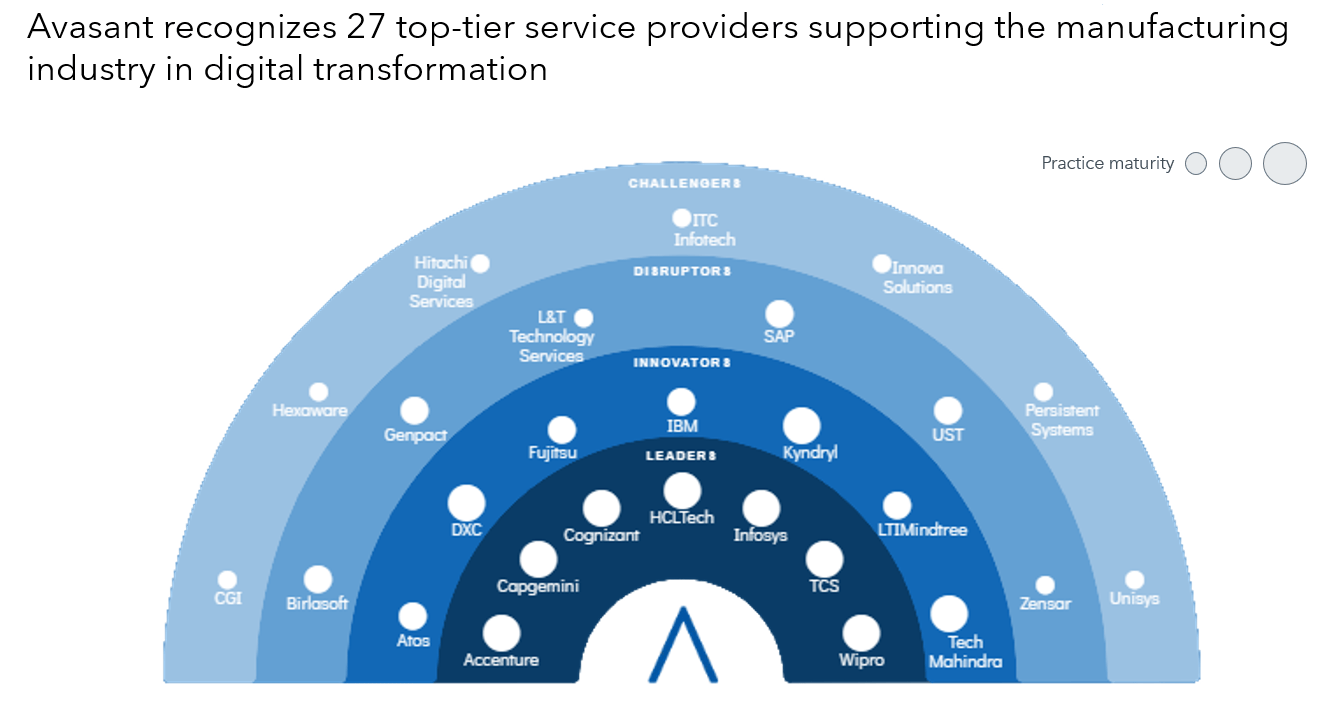
The manufacturing industry is increasingly adopting smart factory practices for efficiency and driving sustainability by facilitating the transition to circular operations and emissions reduction through partnerships. Manufacturers are prioritizing resilient supply chains with investments in data-driven inventory management and reshoring initiatives. They are using advanced technologies such as generative AI for product design acceleration and are transitioning to experience-based offerings using IoT, AI, and 3D printing to meet evolving customer needs. Additionally, investments in connected solutions and facility modernization highlight their commitment to a safer, more productive work environment. Manufacturing enterprises collaborate with service providers for digital transformation, which requires strong technological expertise and delivery capabilities.
April, 2024
-
![Disaster Recovery Requires Consistent Planning Practice adoption Stages Disaster Recovery - Disaster Recovery Requires Consistent Planning]()
Disaster Recovery Requires Consistent Planning
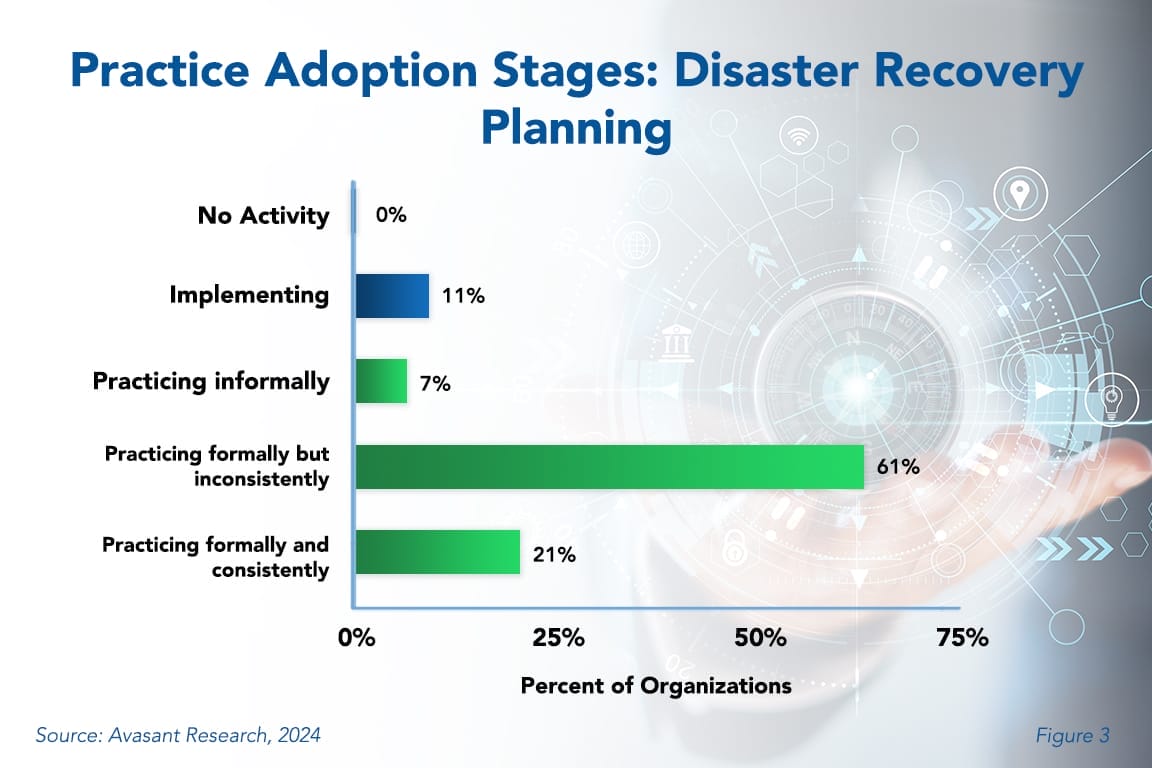
Not many companies are consistently planning for disaster recovery. And if we have learned anything from the past few years of high-profile outages, it is that the ability to recover information systems and data quickly and effectively after a disaster should be an organizational priority. Failure to consistently plan for disaster can cost organizations time and money during an outage. This Research Byte summarizes our full report on disaster recovery planning as a best practice.
April, 2024
-
![The Critical Role of IT Standards, Training, and Documentation in Mitigating Security and Compliance Risks Trend in IT Standards - The Critical Role of IT Standards, Training, and Documentation in Mitigating Security and Compliance Risks]()
The Critical Role of IT Standards, Training, and Documentation in Mitigating Security and Compliance Risks
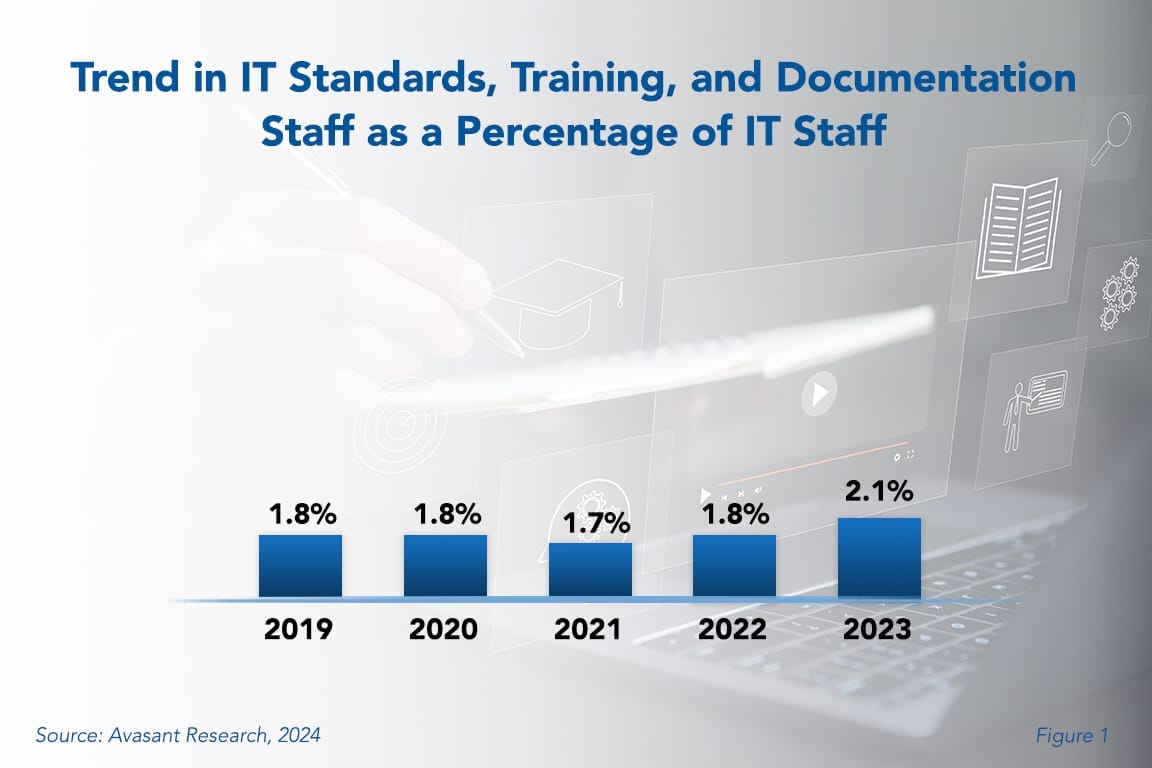
IT standards, training, and documentation job functions are crucial for maintaining the seamless operation, compliance, and efficiency of IT systems. Yet some organizations seem to undervalue its importance. With the rapid pace of change within IT environments, establishing processes to effectively track and manage these changes becomes paramount. This Research Byte examines the reasons for the trend and provides a summary of our full report on IT Standards, Training, and Documentation Staffing Ratios.
April, 2024
-
![Disaster Recovery Planning Best Practices 2024 Practice adoption Stages Disaster Recovery - Disaster Recovery Planning Best Practices 2024]()
Disaster Recovery Planning Best Practices 2024
In 2021, a ransomware attack on Colonial Pipeline, a major fuel supplier in the US, forced the company to shut down operations for several days. This resulted in gasoline shortages and price hikes on the East Coast. Several airline companies in Britain experienced major IT failures in 2023, which resulted in thousands of canceled flights and an estimated $128 million in lost revenue. As these and numerous other examples show, the business impact of a disaster affecting the IT function can be enormous. The ability to recover information systems and data quickly and effectively after a disaster, cyberattack, or system failure should be an organizational priority. However, not many companies are consistently planning for disaster recovery.
April, 2024
-
![IT Standards, Training, and Documentation Staffing Ratios 2024 Trend in IT Standards - IT Standards, Training, and Documentation Staffing Ratios 2024]()
IT Standards, Training, and Documentation Staffing Ratios 2024
Some organizations tend to underestimate the importance of the IT standards, training, and documentation job function since its impact on the bottom line may not be clear. However, these job functions are essential for ensuring the smooth operation, compliance, and effectiveness of IT systems — all crucial elements for the overall success of any business.
April, 2024


