-
IT Management and Administration Staffing Ratios 2019
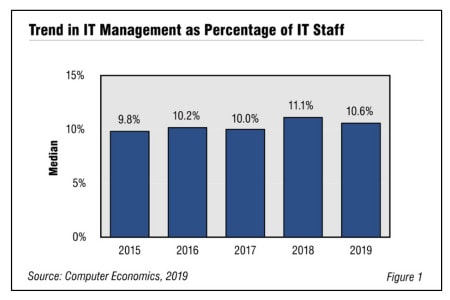
When it comes to IT managers, it is important to find the sweet spot. Too many, and the IT group can become top-heavy and bureaucratic, while too few can leave IT staff members feeling unsupported and without direction. This report examines how many IT managers a well-run IT organization typically requires, along with staffing metrics for two related administrative functions: IT finance/vendor management and clerical support.
August, 2019
-
Database Administration Staffing Ratios 2019
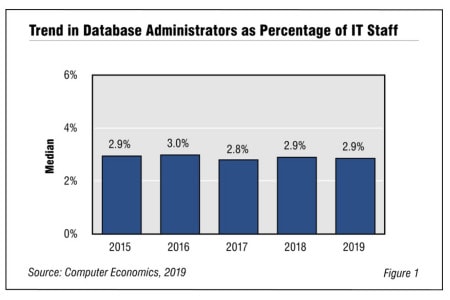
As enterprises collect more data and connect more applications, they must ensure that data is secure, reliable, and accessible. But despite these increased demands, companies are restraining the growth in their database administration staff. This report helps IT managers determine whether they are keeping pace with industry standards by providing four benchmarks: database administrators (DBAs) as a percentage of the IT staff, DBAs as a percentage of the Data Center Group, users per DBA, and business applications per DBA.
October, 2019
-
Application Developer Staffing Ratios 2019
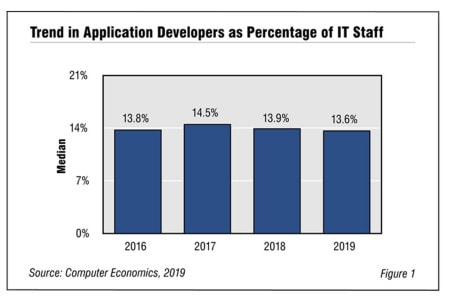
With the use of agile and advent of DevOps, the way that applications are being developed in the enterprise is changing. With these changes, the need for application developers is in flux, and IT organizations can benefit from periodic assessment of their staffing levels. This study uses three metrics to make that assessment: developers as a percentage of the IT staff, users per developer, and applications per developer.
November, 2019
-
Business Analyst Staffing Ratios 2020
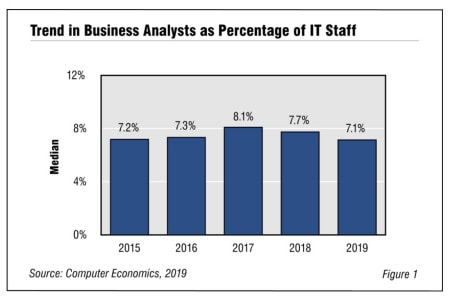
Business analysts continue to play a critical role in IT organizations, although they declined again this year as a percentage of the IT staff. The business analyst serves as a bridge between the IT organization and business users. It is a multifaceted role that is important for ensuring that IT application systems meet business objectives. In this study, we assess staffing levels for the business analyst using four metrics: business analysts as a percentage of the IT staff, business analysts as a percentage of the Application Group, applications per business analyst, and users per business analyst.
January, 2020
-
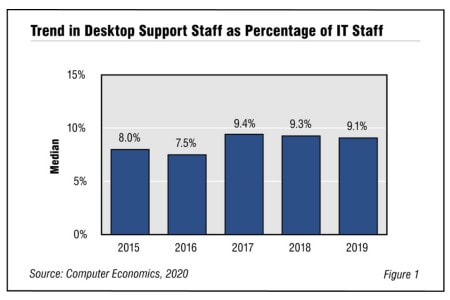
Desktop Support Staffing Ratios 2020
When viewed as a percentage of the total IT staff, the percentage of desktop support personnel has now reached a three-year low. We expect this metric to stay flat or decline further in the near future for several reasons. In this study, we use four metrics for benchmarking: desktop support staff as a percentage of the IT staff, PCs per desktop support staff member, applications per desktop support staff member, and users per support staff member.
February, 2020
-
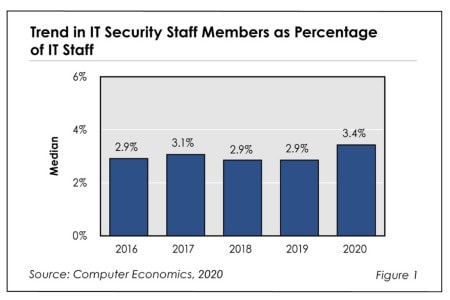
IT Security Staffing Ratios 2020
IT security staffing has finally increased to match increases in IT spending. In this report, we present the five-year trend in IT security staffing and provide benchmarks for understanding IT security staff head count: as a percentage of the IT staff and as a percentage of the Network and Communications Group. We also analyze IT security staffing in terms of the number of applications, users, and network devices.
November, 2020
-
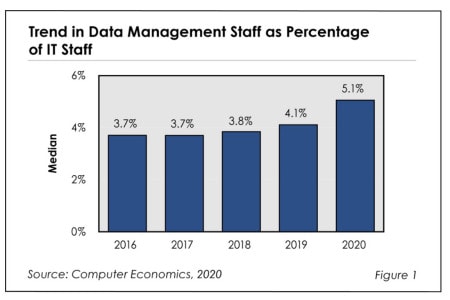
Data Management Staffing Ratios 2020
The data explosion is finally making an impact on data management staffing. Through the middle of the decade, data management staffing plateaued despite the fact that organizations of all sizes were making more use of data. However, data management head count recently has increased significantly. In this study, we use four benchmarks to assess data management staffing levels: data management staff as a percentage of the IT staff, data management staff as a percentage of the Application Group, users per data management staff member, and applications per data management staff member. (21 pp., 10 fig.)
September, 2020
-
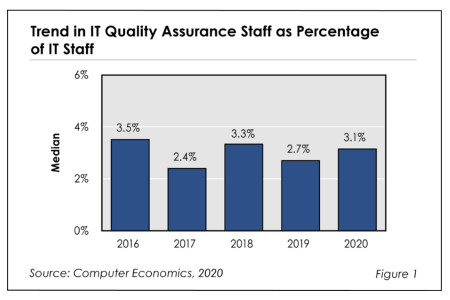
IT Quality Assurance Staffing Ratios 2020
Staffing levels for IT quality assurance personnel are in a state of flux for several reasons, including the new ways in which software is being developed and the varying needs of industry sectors. In this report, we first evaluate recent changes in IT QA staffing levels. We then provide three benchmarks by organization size and by sector: QA staff as a percentage of the IT staff, QA staff as a percentage of the Application Group, and applications per QA staff member.
October, 2020
-
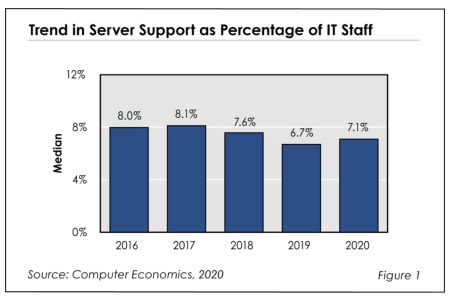
Server Support Staffing Ratios 2020
In state-of-the-art data centers—whether operated on-premises or by managed service providers—demand for server support administrators has declined since 2012. How many server support staff members does an organization need today? To answer that question, we provide four key benchmarks: server support staff as a percentage of the IT staff, users per server support staff member, physical servers per server support staff member, and OS instances per server support staff member.
September, 2020
-
Pay for Performance: Popularity and Impact of Incentive Pay in the IT Workforce
Incentive pay programs have been popular for decades, because many business managers believe that paying for performance can motivate workers and increase productivity. Nevertheless, the largest incentive-pay packages are becoming less common, and there is a flattening of incentive pay as a component of overall compensation. This report we provide data on the percentage of employees receiving incentive pay by job level, the percentage of compensation comprising incentive pay, and the percentage of incentive pay based on individual, group, and company performance. We conclude with recommendations for implementing effective incentive pay programs and mitigating the unintended consequences. (17 pp., 4 fig.) [Research Byte]
November, 2019
-

IT Security Staffing Ratios 2019
IT security budgets are rising again this year in the wake of a continuing onslaught of high-profile ransomware attacks. For many IT organizations, this means it may be time to reassess the adequacy of their IT security staffing levels. In this report, we present the five-year trend in IT security staffing and provide benchmarks for understanding IT security staff head count: as a percentage of the IT staff and as a percentage of the Network and Communications Group. We also analyze IT security staffing in terms of the number of applications, the number of users, and the number of network devices. In addition, our analysis includes the influence of organization size and sector on staffing requirements. We conclude with recommendations for optimizing IT security staffing. (22pp., 9 fig.) [Research Byte]
October, 2019
-

Network Support Staffing Ratios 2019
The importance of computer networks cannot be overstated in this digital age. Yet remarkably, network support staff levels dropped in recent years and show no signs of rebounding. This report will help IT managers determine whether their organization is keeping pace with improvements in network management by comparing their network support staffing ratios against industry benchmarks. We provide four benchmarks: network support staff as a percentage of the IT staff, network support staff as a percentage of the Network and Communications Group, network devices per network support staff member, and users per network support staff member. We provide benchmarks by organization size and sector. We conclude with recommendations for reducing or at least maintaining the cost of network support staff. (21 pp., 9 fig.) [Research Byte]
March, 2019
-

Server Support Staffing Ratios 2019
In state-of-the-art data centers—whether operated on-premises or by managed services providers—demand for server support administrators has been steadily declining over the past decade. How many server support staff members does an organization need today? To answer that question, we provide four key benchmarks: server support staff as a percentage of the IT staff, users per server support staff member, physical servers per server support staff member, and OS instances per server support staff member. We provide these metrics for small, midsize, and large organizations. We also assess how industry sector can influence server support staffing metrics. We conclude with recommendations for improving server support productivity. (23 pp, 10 fig.) [Research Byte]
February, 2019

 Grid View
 List View