
Areas of Interest
Content Type
Industries
- Aerospace and defense
- Banking, Financial Services, and Insurance
- Energy and Resources
- Federal Government
- Healthcare and life sciences
- High-tech and telecommunications
- Higher Education
- Media and entertainment
- Private equity
- Public Sector
- Retail and manufacturing
- Social Impact Institutions
- Travel and transportation
Technologies
- Artificial Intelligence
- Automation
- Blockchain
- Business and data analytics
- Cloud
- Customer relationship management (CRM)
- Cybersecurity
- Digital Services
- Enterprise resource planning (ERP)
- Human capital management (HCM)
- Internet Of Things
- Machine Learning
- Networking
- Supply chain management (SCM)
- Virtual reality/Augmented reality
Areas of Interest
Latest Reports
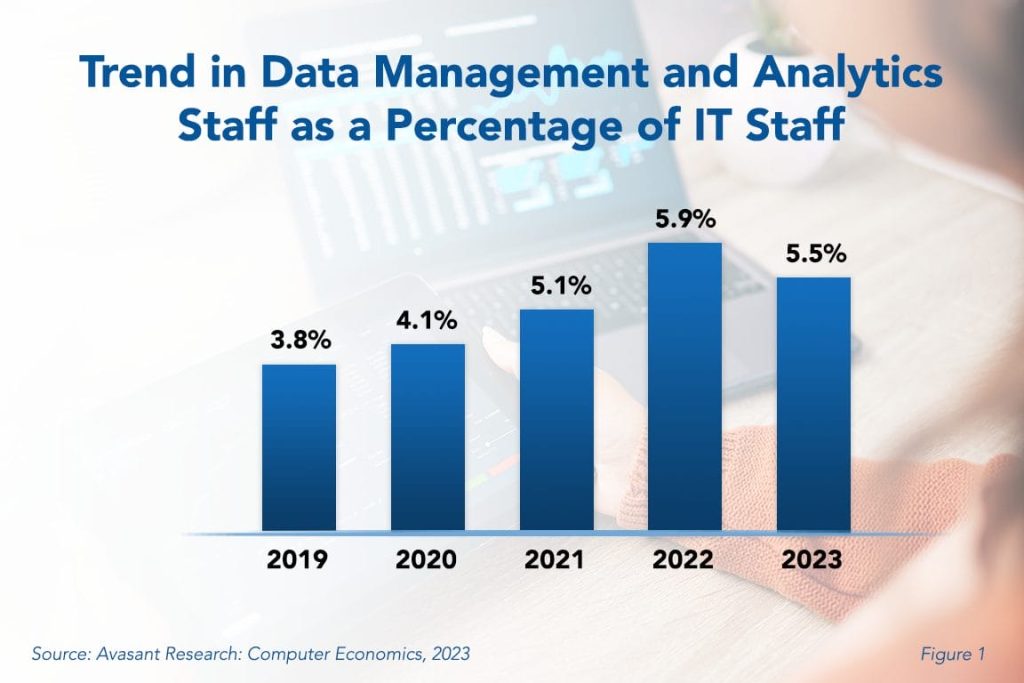
Data Management and Analytics Staffing Ratios 2023
The amount of data that IT organizations need to manage is growing with no end in sight. Whether it be sensor data from IoT devices, social networking data, online advertising and e-commerce transactions, or multimedia files, the complexity of the data to be analyzed also is increasing. With the continued growth of data and its importance in the day-to-day activities of organizations, it is surprising that the data management and analytics function has decreased this year. After significant growth over previous years, this staffing ratio has declined to 5.5% in 2023 from 5.9% in 2022.
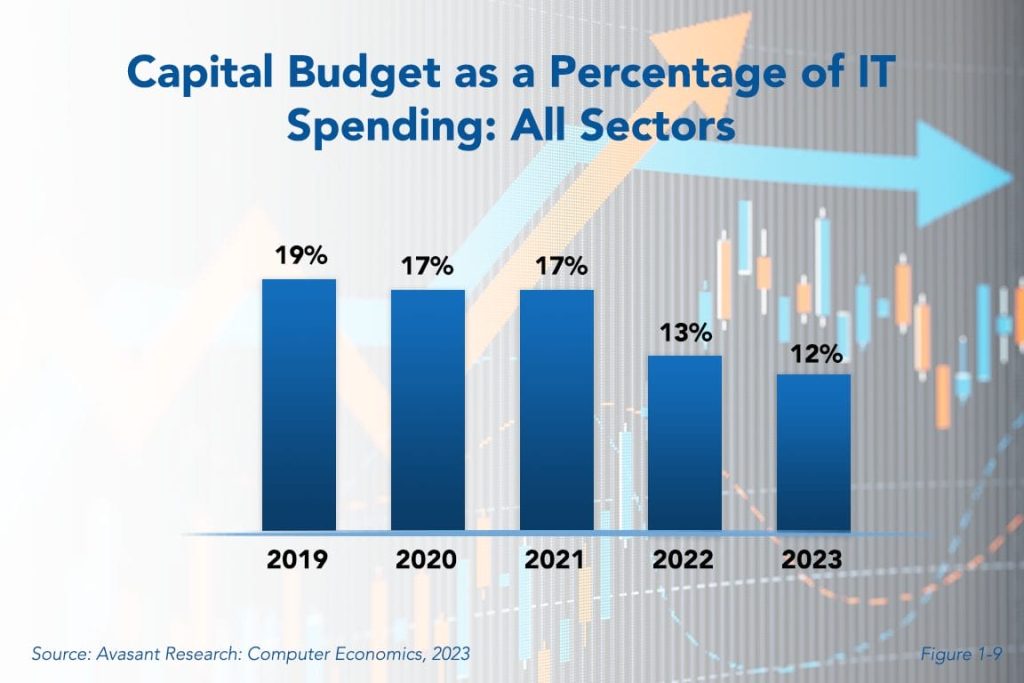
How Low Can They Go? IT Capital Budgets Still Declining
It is not a surprise that capital budgets are falling as a percentage of total IT budgets. Cloud and SaaS have been diverting capital spending for quite some time. But what is a surprise is that capital spending continues to fall even though it only makes up 12% of the total IT budgets. IT capital spending will never disappear completely, but just where is the floor? This research byte is a brief description of some of the findings in our IT Spending and Staffing Benchmarks 2023/2024 study.

Rethinking Customer Experience in Uncertain Times
Over the past 12–18 months, customer-facing functions, enterprise applications, and processes have changed tremendously. There has been an uptake in digital channels, direct-to-consumer commerce, omnichannel digital communications, and SaaS-based application services. The period has also witnessed a rise in preference for data and AI-driven, personalized, and automated experiences. This Research Byte showcases how customers’ quest for enhanced personalization and seamless experiences has increased the demand for SaaS-based solutions for addressing industry-specific business needs and how service providers are facilitating this transformation in North America. We highlight the efforts of one such service provider, TCS, based on its recent analyst day in June 2023.

Higher Education Digital Services 2023–2024 Market Insights™
The Higher Education Digital Services 2023–2024 Market Insights™ assists organizations in identifying important demand-side trends that are expected to have a long-term impact on any digital projects in the higher education space. The report also highlights key challenges that enterprises face today.
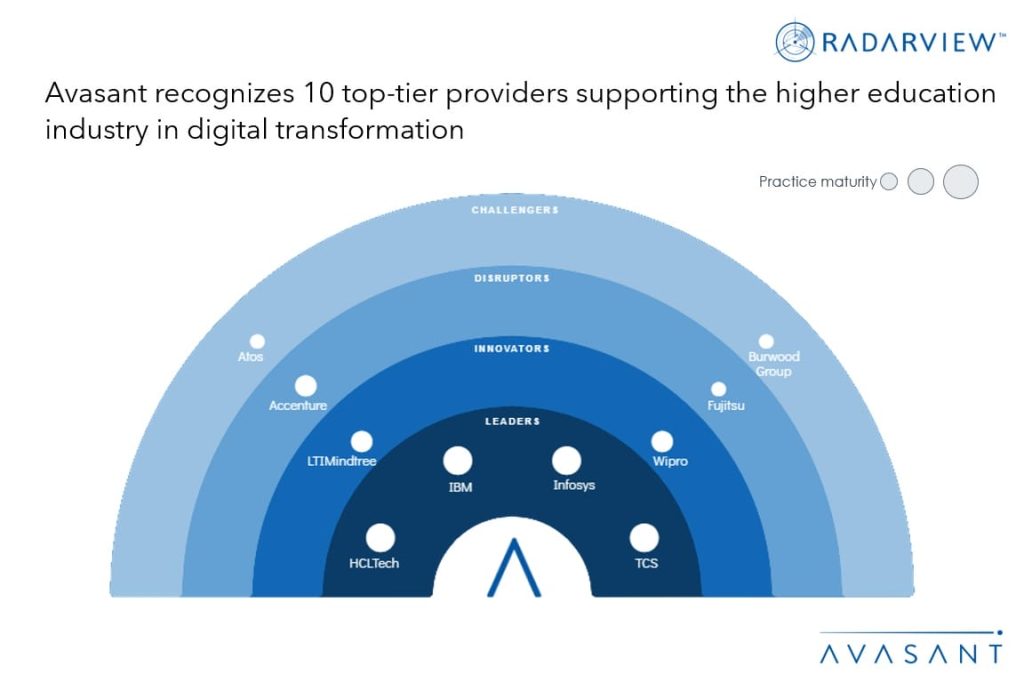
Higher Education Digital Services 2023–2024 RadarView™
The Higher Education Digital Services 2023–2024 RadarView™ helps higher education institutes craft a robust business strategy based on industry outlook, best practices, and digital transformation. The report can also aid them in identifying the right partners and service providers to accelerate their digital transformation in the higher education space. In addition, the 49-page report highlights top market trends in the higher education space and Avasant’s viewpoint on them.
Higher Education Digital Services: Leveraging Digital Transformation to Facilitate Online and Lifelong Learning
To adapt to evolving customer demands, higher education institutes are gravitating toward digital technologies to provide personalized and immersive experiences to students and provide a blended learning experience. Higher education institutes are leveraging AI, analytics, cloud, and AR/VR to provide customized content and support to students. Institutes are also putting emphasis on lifelong learning and continuing education to enable employees to upskill and reskill throughout their professional journeys. Both demand- and supply-side trends are covered in Avasant’s Higher Education Digital Services 2023–2024 Market Insights™ and Higher Education and Entertainment Digital Services 2023–2024 RadarView™, respectively.
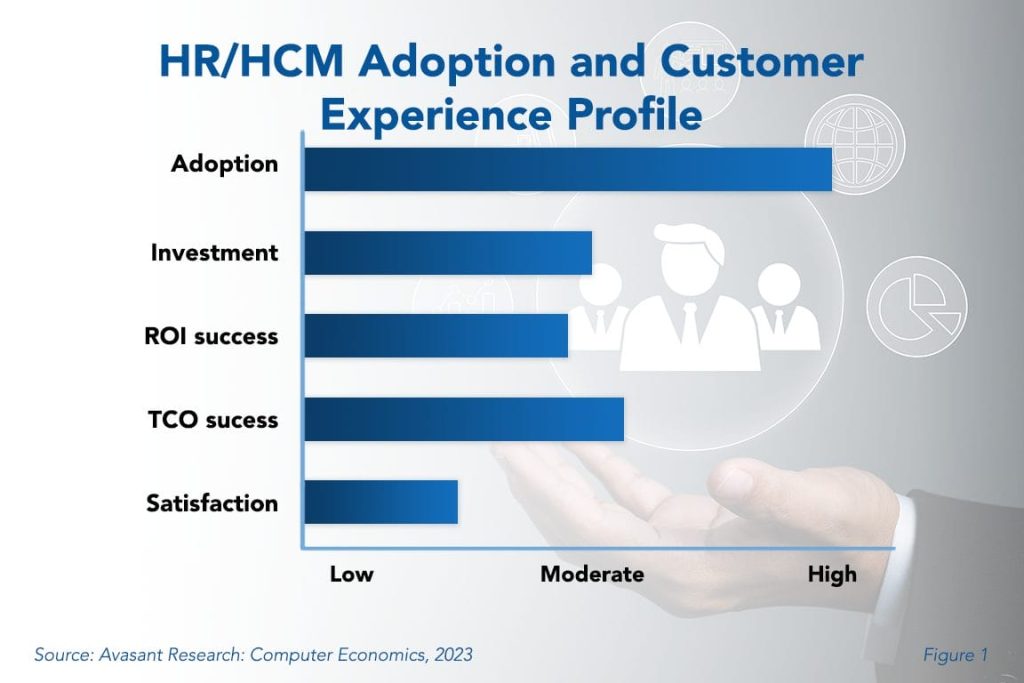
HR/HCM Adoption Trends and Customer Experience 2023
In the past, human resources (HR) departments were typically seen as cost centers, but there is a growing appreciation for the strategic value that HR can bring to an organization. By embracing HR’s strategic role, organizations may realize the full potential of the function as a value-add that propels business success.
Optimizing HR Processes: HCM Systems Close the Talent Gap
Executives are becoming more aware of the vital role that human capital management (HCM) systems play in the success of their organizations. Comprehensive, cloud-based HCM systems enable business leaders to manage all facets of their HR processes, from hiring and onboarding through performance reviews and remuneration. This Research Byte summarizes the full report, HR/HCM Adoption Trends and Customer Experience.
Integration Platform as a Service 2022 RadarView™ Scan
Avasant’s Integration Platform as a Service RadarView Scan helps enterprises in evaluating key vendors supporting enterprise adoption of integration platforms. It compares the capabilities of these vendors by conducting an in-depth analysis of the solutions developed, enterprise use cases addressed, and developments made. The 17-page report also highlights key business challenges and how iPaaS vendors mitigate these challenges with their offerings.
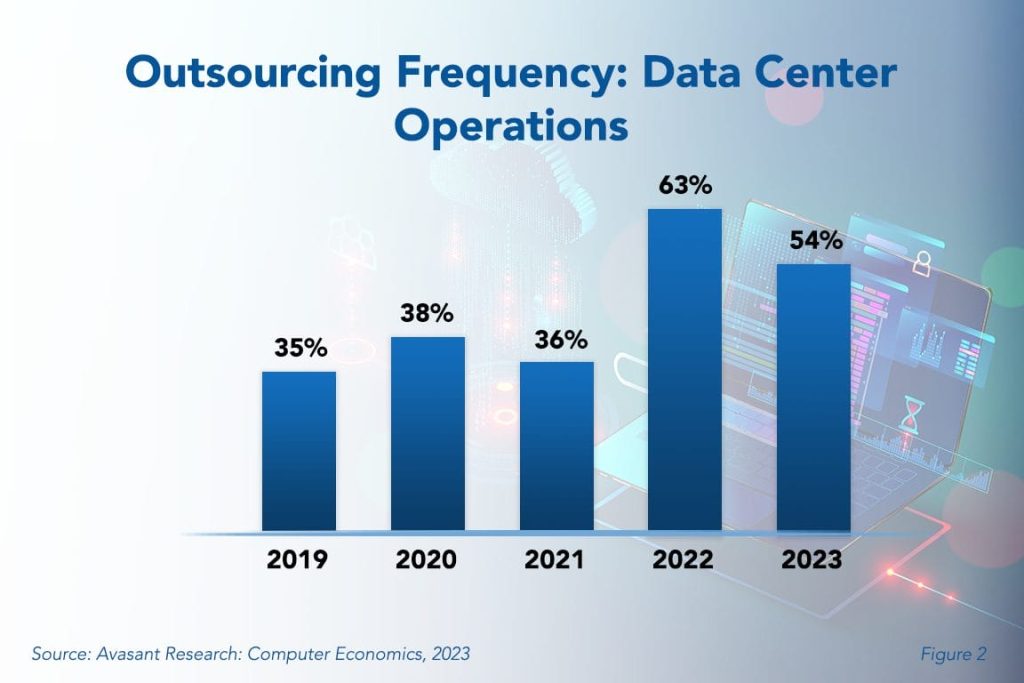
Data Center Operations Outsourcing Trends and Customer Experience 2023
As data centers become larger, more automated, virtualized, and complex, service providers can leverage expertise and economies of scale to provide attractive alternatives to on-premises data centers. On the other hand, turning over data center operations to a service provider or moving applications to a hosting site can entail risk. Making the choice to outsource data center operations can reduce the infrastructure budget, but when managed incorrectly the outcome can be adverse.