
Areas of Interest
Content Type
Industries
- Aerospace and defense
- Banking, Financial Services, and Insurance
- Energy and Resources
- Federal Government
- Healthcare and life sciences
- High-tech and telecommunications
- Higher Education
- Media and entertainment
- Private equity
- Public Sector
- Retail and manufacturing
- Social Impact Institutions
- Travel and transportation
Technologies
- Artificial Intelligence
- Automation
- Blockchain
- Business and data analytics
- Cloud
- Customer relationship management (CRM)
- Cybersecurity
- Digital Services
- Enterprise resource planning (ERP)
- Human capital management (HCM)
- Internet Of Things
- Machine Learning
- Networking
- Supply chain management (SCM)
- Virtual reality/Augmented reality
Areas of Interest
Latest Reports

Finance and Accounting Business Process Transformation 2024–2025 Market Insights™
This report identifies key demand-side trends in the F&A business process transformation space to help enterprises fine-tune their operations. It provides an overview of key observations and business challenges that Avasant considers important to highlight in the F&A outsourcing space.
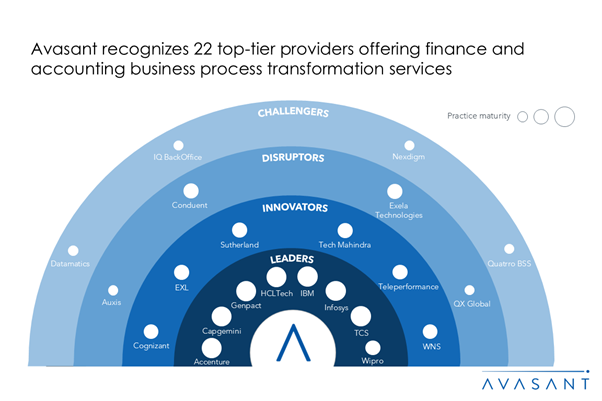
Shifting from Transactional to Value-based F&A Services due to Evolving Customer Expectations
The finance and accounting (F&A) BPO industry is navigating a dynamic phase marked by rapid technological advancements, evolving regulatory landscapes, and shifting client expectations. Service providers are adopting advanced technologies such as AI, ML, and RPA to automate routine tasks, improve compliance accuracy, and deliver financial insights. Meanwhile, regulatory changes are pushing for more stringent reporting and data transparency, compelling providers to innovate in governance and risk management practices. These developments are fueling the demand for F&A BPO services that enable organizations to achieve cost optimization, scalability, and strategic decision-making, evidenced by about a 13% growth in service providers’ revenue. Both demand- and supply-side trends are covered in Avasant’s Finance and Accounting Business Process Transformation 2024–2025 Market Insights™ and Finance and Accounting Business Process Transformation 2024–2025 RadarView™, respectively.

Blockchain Services 2024 Market Insights™
This report highlights key demand-side trends in the blockchain space, guiding enterprises in refining their blockchain strategy. It covers essential technology and blockchain services trends, insights, and challenges faced by enterprises based on Avasant’s assessment.
Blockchain Services: Advancing Innovation, Sustainability, and Security through Blockchain Technology
Enterprises are increasingly adopting blockchain to enhance transparency, security, and efficiency across various sectors. The banking, government, and manufacturing sectors are leading with the maximum success rate in converting blockchain projects from proofs of concepts (POCs) to production. Blockchain fosters consumer trust through supply chain transparency and product authenticity. The integration of AI with blockchain drives data integrity and decentralized networks. Central banks are developing central bank digital currencies (CBDCs) to streamline cross-border payments. Additionally, blockchain supports sustainable innovation and regulatory compliance, promoting green finance and verifying carbon credits for environmental goals.
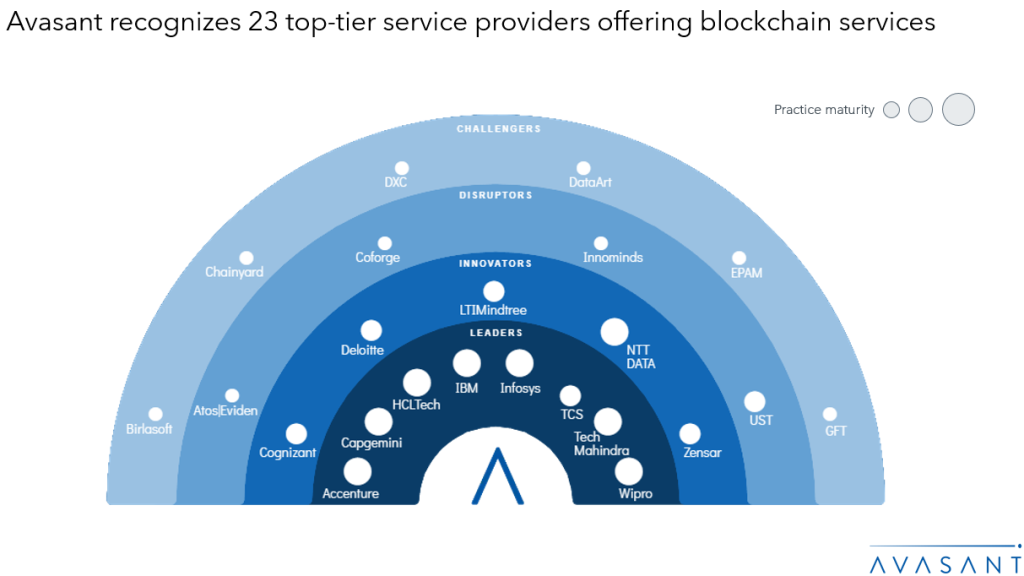
Blockchain Services 2024 RadarView™
The Blockchain Services 2024 RadarView™ helps enterprises identify key use cases and develop a strategy for blockchain adoption. The report highlights service providers who can accelerate business transformation and offers detailed analyses of leading providers’ capabilities to help select the right partners. The 66-page report also covers key industry trends and Avasant’s insights on the blockchain space.
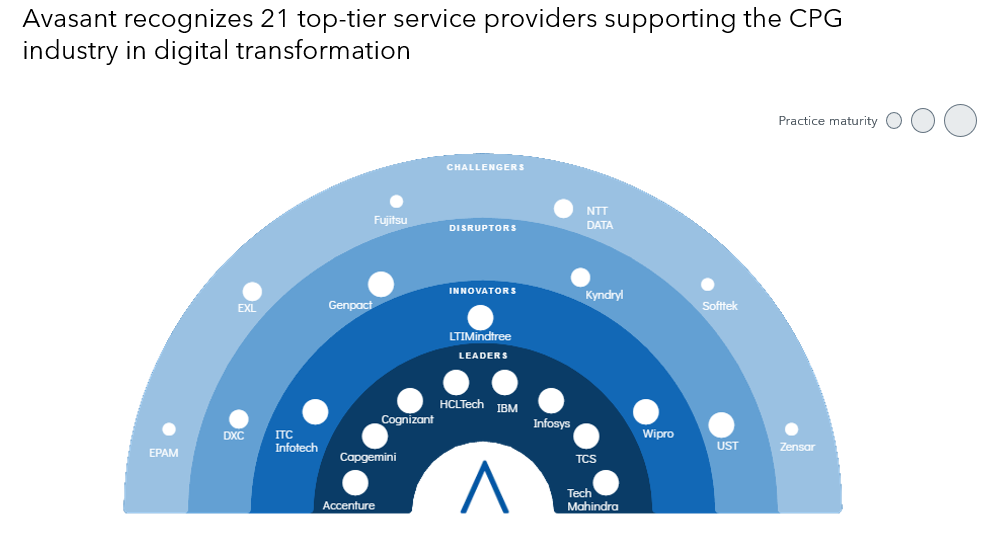
Utilizing Generative AI and Intelligent Automation to Digitize the Consumer Goods Industry
Consumer packaged goods (CPG) companies are increasingly investing in AI-driven marketing technologies to enhance campaign effectiveness, establish brand differentiation, and improve ROI. They are also leveraging IoT solutions to optimize supply chain efficiency and ensure product availability while utilizing blockchain technology to guarantee product authenticity. Moreover, the use of generative AI is helping CPG companies identify new market opportunities and aid in product development. In manufacturing, companies are adopting smart practices like 3D printing, collaborative robots, and AI to reduce operational waste and minimize inventory needs. Additionally, they are rethinking product packaging to meet their ESG goals while maintaining sustainable supply chains for raw material procurement.

CPG Digital Services 2024 Market Insights™
o The CPG Digital Services 2024 Market Insights™ assists organizations in identifying important demand-side trends that are expected to have a long-term impact on any digital project in the consumer packaged goods industry. The report also highlights key challenges that enterprises face today.
CPG Digital Services 2024 RadarView™
The CPG Services 2024 RadarView™ helps consumer packaged goods enterprises craft a robust strategy based on industry outlook, best practices, and digital transformation. The report can also aid them in identifying the right partners and service providers to accelerate their digital transformation in this space. The 83-page report also highlights top market trends in the consumer packaged goods space and Avasant’s viewpoint.

Avasant SAP S/4HANA Services 2024–2025 Market Insights™
The SAP S/4HANA Services 2024–2025 Market Insights™ assists organizations in identifying important demand-side trends that are expected to have a long-term impact on any SAP S/4HANA migration projects. The report also highlights key challenges that enterprises face.
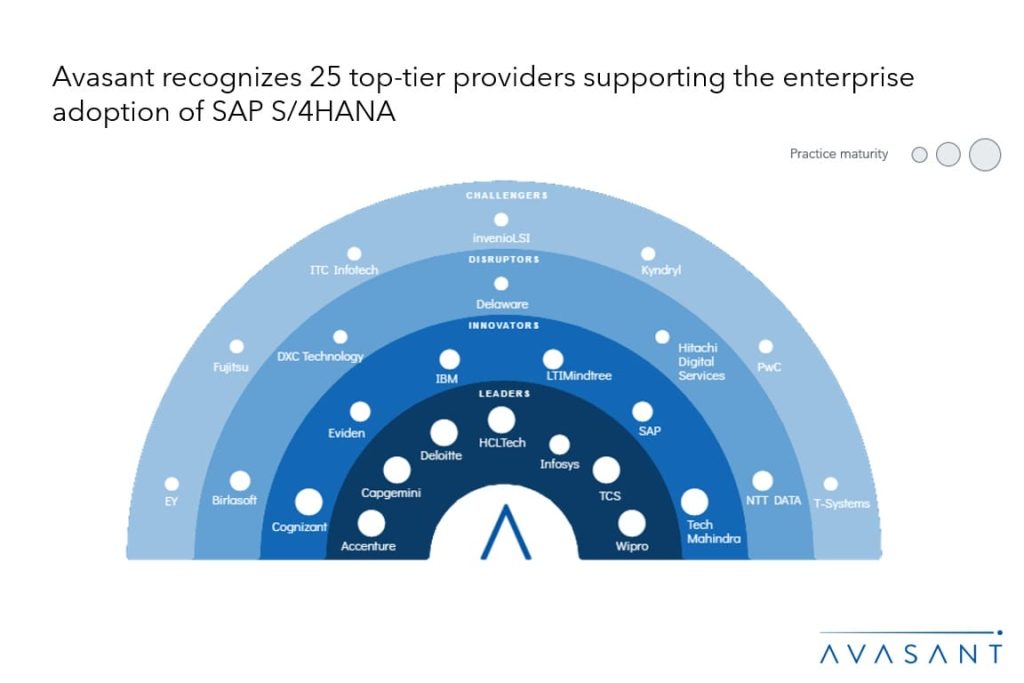
SAP S/4HANA–Generative AI Confluence Drives Efficient Operations and Accurate Business Decisions
As enterprises seek to enhance operational efficiency and user experience, the integration of generative AI with SAP S/4HANA is gaining momentum. This is driving improvements in critical business processes such as procurement, financial management, supply chain optimization, and asset maintenance. Service providers are responding by developing tailored, industry-specific AI solutions through in-house efforts and collaboration with SAP and other technology partners. To maximize the ROI and reduce time to market, organizations are adopting phased implementation strategies, testing outcomes through proof of concepts, and leveraging service providers’ assets with preconfigured business processes.