
Areas of Interest
Content Type
Industries
- Aerospace and defense
- Banking, Financial Services, and Insurance
- Energy and Resources
- Federal Government
- Healthcare and life sciences
- High-tech and telecommunications
- Higher Education
- Media and entertainment
- Private equity
- Public Sector
- Retail and manufacturing
- Social Impact Institutions
- Travel and transportation
Technologies
- Artificial Intelligence
- Automation
- Blockchain
- Business and data analytics
- Cloud
- Customer relationship management (CRM)
- Cybersecurity
- Digital Services
- Enterprise resource planning (ERP)
- Human capital management (HCM)
- Internet Of Things
- Machine Learning
- Networking
- Supply chain management (SCM)
- Virtual reality/Augmented reality
Areas of Interest
Latest Reports

LSX World Congress Europe 2026: How AI, Platform Innovation, and Global Capital Convergence Are Reshaping Life Sciences Strategy
Held at the Lisbon Congress Centre, Portugal, from March 25–26 (with pre-day CEO forums on March 24), the 12th edition of LSX World Congress Europe (LSX26) marked a pivotal inflection point for the European life sciences ecosystem. For the first time, LSX26 was co-located with BIO-Europe Spring as part of Life Science Spring Innovation Week, creating a concentrated four-day corridor that brought together biotech, medtech, and pharmatech C-suites, venture capitalists, pharma business development and licensing leaders, and digital health innovators in a single city.

HIMSS Global Health Conference & Exhibition 2026: How AI, Interoperability, and Resilience Are Redefining Healthcare Delivery
HIMSS Global Health Conference & Exhibition 2026 showcased a shift toward AI-powered, interoperable, and resilient healthcare systems, as providers adapt to rising costs, workforce strain, and growing data complexity.
Business Process Services – Provider Trends CQ4 2025
In this quarterly report for CQ4 2025, Avasant provides key information on trends in the business process services (BPS) space. It covers facts and figures about service providers (including revenue and resource trends), macro trends, and executive sentiment from the service provider community. The geographic coverage is global, with a larger share of data points from North America. The report builds on insights gathered through ongoing market research, data collection, and proprietary databases. It includes market data from providers accessed through multiple sources, such as public disclosures and market interactions.

Agentic AI Use Cases and Adoption in the Life and Annuity Insurance Industry Playbook
Life and annuity (L&A) insurers are beginning to move beyond AI-assisted decision-making toward more agent-led execution models, supported by advances in foundation models, orchestration capabilities, domain-specific platforms, and evolving regulatory clarity. Agentic AI introduces the potential to coordinate and execute multistep workflows across underwriting, policy administration, servicing, and claims with reduced manual intervention. While adoption remains in early stages, L&A insurers are starting to prioritize high-volume, repeatable processes for near-term efficiency gains and are evaluating more complex workflows for phased autonomy, supported by governance, auditability, and integration with core systems.

Benelux Digital Services 2026 Market Insights™
The Benelux Digital Services 2026 Market Insights helps organizations identify key demand-side trends expected to have a long-term impact on digital projects in the Benelux region. The report also highlights key challenges that enterprises in the region face today.
Benelux Digital Services: Advancing Productivity, Resilience, and Sustainability Through Emerging Technologies
Benelux enterprises are rapidly advancing from isolated AI pilots to governed, enterprise‑wide deployments aimed at improving productivity through automation and real‑time insights. Growing concerns around data sovereignty, regulatory compliance, and cyber resilience are accelerating the shift toward secure hybrid and multicloud infrastructures supported by high‑performance connectivity for distributed workforces. At the same time, organizations are strengthening security through zero‑trust frameworks and continuous risk management while embedding sustainability into technology decisions via ESG adoption, carbon reduction initiatives, and alignment with EU and national climate objectives.
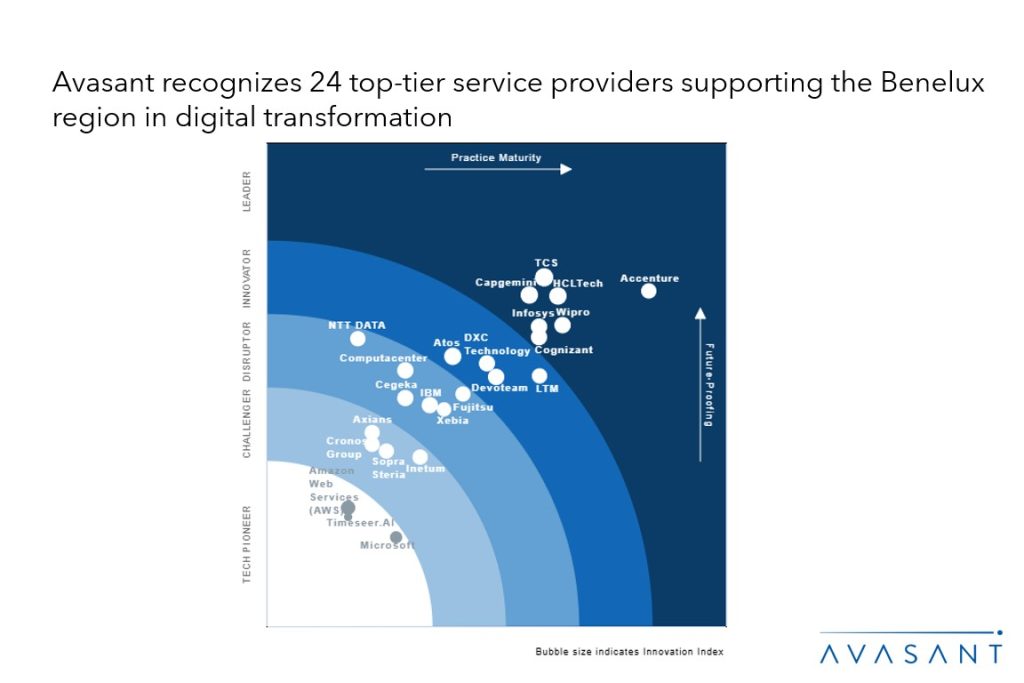
Benelux Digital Services 2026 RadarView™
The Benelux Digital Services 2026 RadarView™ can help enterprises in the Benelux region craft a robust strategy based on regional outlook, best practices, and digital transformation. The report can also help them identify the right partners and service providers to accelerate their digital transformation. The 89-page report also highlights top market trends in Benelux and Avasant’s viewpoint on them.
Fair Market Value April 2026
The Computer Economics Market Value Reports provide information on the most commonly traded machines and systems at the time the report is published. The values shown are the composites of a range of quotes acquired from sources within the industry deemed reliable, accuracy of the information presented is not guaranteed. Resources are eBay, Insight, NewEgg, CDW, ETB-Tech, Amazon, Savemyserver, TheServerStore, LoadBalancer, NetworkOutlet, Netsyst-Direct, TigerDirect, and others as well as online sales companies and appraisals.

Mobile World Congress 2026: Redefining Network Value Beyond Connectivity
Mobile World Congress (MWC) 2026 introduced “The IQ Era” as a structural shift in how networks are designed, operated, and used. GSMA’s priorities around completing the transition to 5G standalone, integrating AI into core network functions, and strengthening digital safety signal a move away from simple connectivity toward programmable 5G‑AI platforms built on open APIs, with monetization and operational readiness becoming central design considerations. Networks are increasingly being positioned as programmable infrastructure, where AI‑driven operations, automation, and resilience are embedded from the outset.

Decentralizing Trust: Blockchain as Strategic Infrastructure for State and Local Government Modernization
State and local governments operate at the front line of the citizen experience, providing services such as permit issuance, land record management, benefit distribution, election administration, and sensitive data protection. Yet institutional trust remains structurally fragile.